What is a therm?
A therm is a unit of heat energy. On gas bills, it represents the amount of natural gas you used during the billing period. One therm is equal to 100,000 BTUs. Your bill charges a price per therm, plus delivery and customer charges.
Some utilities bill in cubic feet instead of therms. The bill will show a conversion factor that translates cubic feet into therms based on the energy content of the gas.
This conversion is normal and does not mean your gas quality is poor. It is simply an accounting method that makes billing consistent.
Common gas bill line items
Most gas bills have two main parts: supply and delivery. Supply is the cost of the gas itself. Delivery covers the pipes, maintenance, and service operations. You may also see a fixed customer charge that applies even if you use little gas.
| Line item | What it means |
|---|---|
| Therms used | Total gas energy used in the period |
| Supply rate | Price per therm for the gas |
| Delivery charges | Cost to transport gas to your home |
| Customer charge | Fixed monthly fee |
If your bill allows you to choose a supply provider, the supply rate may be a separate section. The delivery portion usually stays with your local utility.
A simple therm cost example
If your bill shows 60 therms at $1.40 per therm, the supply portion is $84. Add a $25 delivery charge and a $15 customer charge, and the total before tax is about $124. This breakdown helps you see which part of the bill is usage-based and which part is fixed.
If you reduce therm usage, the fixed charges remain. That is why gas bills can still be noticeable even in warm months when usage is low.
Taxes and regulatory surcharges may appear as separate lines. They are usually small but can add a few dollars to the total each month.
If your bill includes a fuel adjustment, it may change monthly based on market costs.
Why gas usage jumps in winter
Gas usage increases in winter due to heating. Furnaces and boilers consume the majority of therms, while cooking and water heating are smaller contributors. The spike is normal if temperatures are lower or the billing cycle is longer.
If your usage seems too high, check your thermostat settings, filter cleanliness, and insulation. Even small drafts can increase runtime.
Heating degree days explain seasonal swings
Utilities often track heating degree days, which measure how cold a day is relative to a baseline temperature. More degree days mean more heating demand and higher therm usage. If your usage is high during a month with many degree days, it is likely weather-driven.
Comparing therms per degree day is a useful way to assess whether your home is becoming more or less efficient over time.
Some utilities list degree day information in the bill summary. If your bill does not, you can often find local degree day data through weather services online.
Compare usage the right way
Compare therms per day rather than total therms. This accounts for varying billing cycles. Many utilities also provide year-over-year comparisons to show whether your usage is typical for the season.
If your bill uses estimated readings, you may see a correction on the next bill when an actual read occurs.
Estimated reads and true-up bills
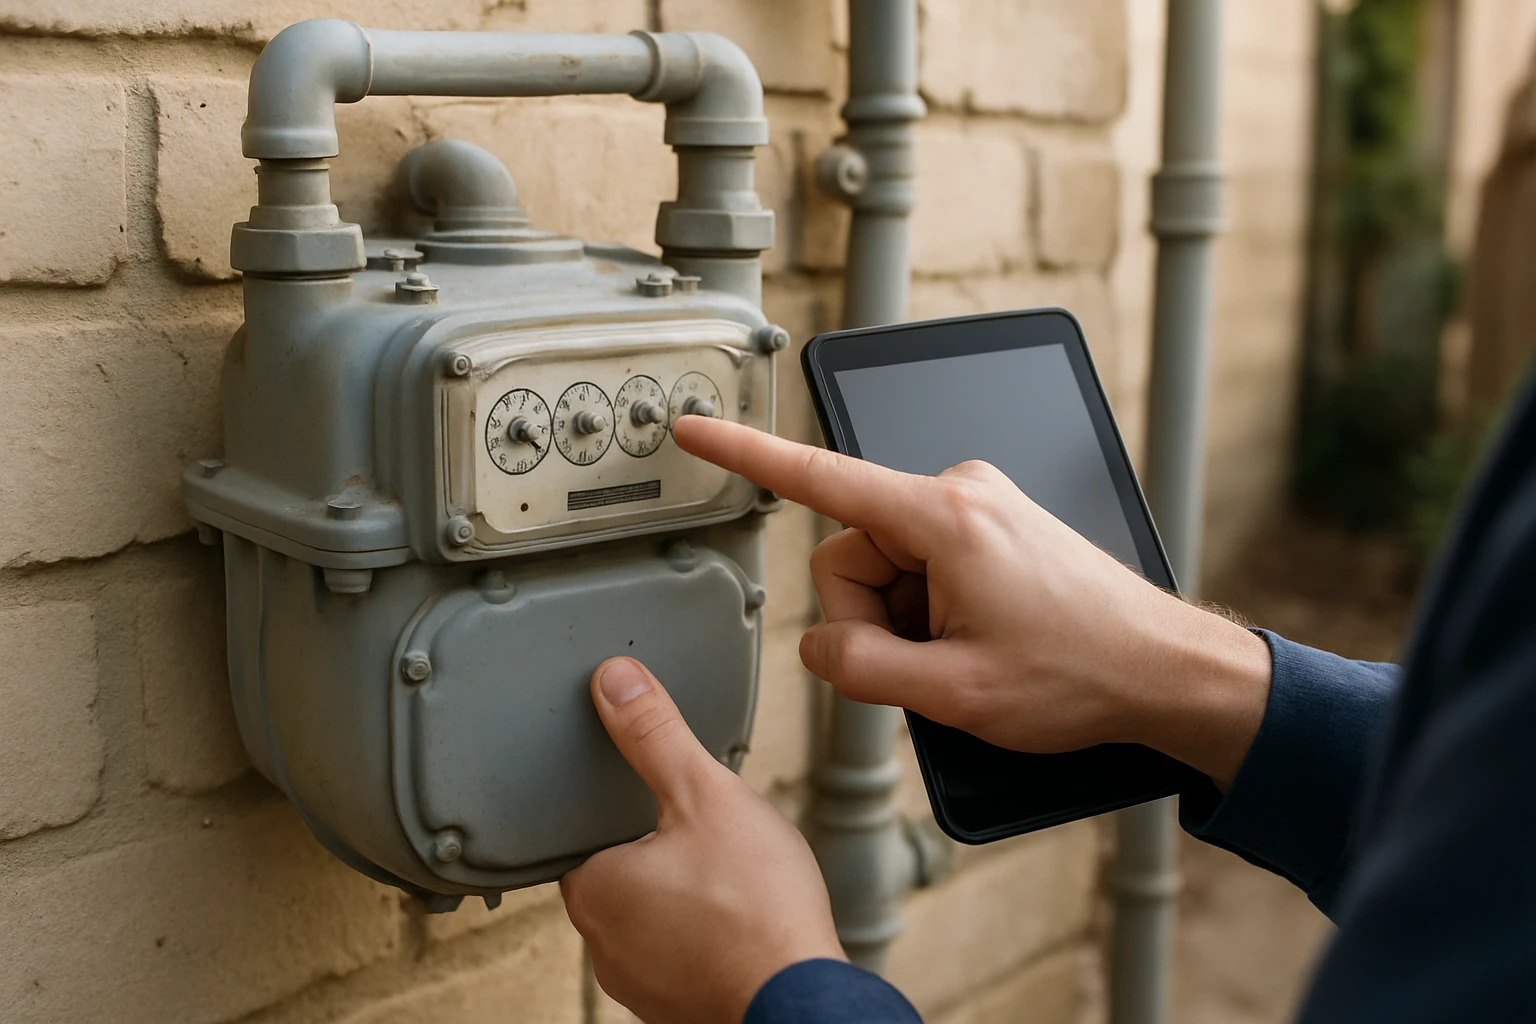
If a meter reader cannot access your meter, the utility may estimate your usage. The next actual read can result in a higher or lower bill as the estimate is corrected. If your bill seems off, check for an estimated reading note.
You can often submit your own reading to avoid estimates. Ask your utility whether self-reporting is an option in your area.
Keeping a photo of your meter on the read date can be helpful if you need to dispute an estimate later.
Use summer bills as a baseline
Summer gas bills can provide a baseline for non-heating usage like cooking and water heating. If your summer therms are high, check the water heater temperature and look for gas leaks or pilot lights that stay on when not needed.
Comparing the winter bill to the summer baseline helps you estimate how much of the total is driven by space heating versus other uses.
Check usage through online portals
Many gas utilities provide daily usage data in an online account. Reviewing those charts can help you see whether usage increases align with cold weather or specific habits like long showers or frequent dryer cycles.
If the daily data shows steady high usage even on warm days, that may indicate a water heater issue or a gas appliance running longer than expected.
Pair the usage chart with outside temperatures if the portal includes that view. It helps confirm whether spikes are weather-driven.
Ways to reduce therms without losing comfort
- Set the thermostat lower overnight and when away.
- Seal drafts around doors and windows.
- Use a programmable thermostat for consistent schedules.
- Keep vents and returns clear for better airflow.
- Consider annual maintenance for your furnace.
Lowering usage by even 5% to 10% can make a noticeable difference over a winter season. For electric heating comparisons, see ourgas vs. electric guide.
Frequently asked questions
Gas energy content can vary slightly. The conversion factor ensures your bill reflects the actual heat value of the gas you used.