Data: U.S. EIA Winter Fuels Outlook, published October 6, 2026 · Forecasts shift with weather — EIA updates monthly
Quick Answer
Per the U.S. EIA’s Winter Fuels Outlook (Oct 6, 2026), this winter splits cleanly by fuel: natural gas homes (about half of U.S. households) should pay about 9% LESS — roughly $640 for November through March; electric-heat homes (over 40% of households) about 4% MORE — roughly $1,196; propane homes about 3% less ($1,246); and heating-oil homes (about 3% of households, mostly Northeast) a painful 21% MORE — $2,115, on fuel averaging $5.26/gallon, up 34%. Regionally the story bends around a strong El Niño: warmer East, much colder West — gas bills in the West actually RISE ~7% despite cheaper gas, and electric bills there rise ~9%.
January is the peak month for every fuel: gas averages $146, electric heat $270, oil $509 in January alone.
The Headline Table (U.S. Averages, Nov-Mar)
| Primary heating fuel | Share of U.S. homes | Forecast winter spend | vs last winter | Winter fuel price | Price change |
|---|---|---|---|---|---|
| Natural gas | ~half | $640 | -9% | $13.44 per thousand cu ft (avg) | -9% |
| Electricity | ~40%+ | $1,196 | +4% | 18.23¢/kWh (winter avg) | +3% |
| Propane | ~5% | $1,246 | -3% | $2.52/gallon | -2% |
| Heating oil | ~3% | $2,115 | +21% | $5.26/gallon | +34% |
Two mechanical notes worth understanding before reading anything into these numbers. First, the EIA is explicit that these are broad comparisons of this winter vs. last winter for typical homes on each fuel — not a ranking of which fuel is “cheaper to have,” because the housing stocks differ (electric-heat homes skew newer and milder-climate; oil homes skew old and Northeast). Second, prices drive most of this year’s divergence: gas is cheaper, oil much dearer, while weather (El Niño) redistributes the regional pain.
The Regional Tables
Natural gas homes — average winter spend by region
| Region | Total (Nov-Mar) | vs last winter |
|---|---|---|
| Northeast | $879 | -14% |
| Midwest | $613 | -10% |
| South | $511 | -15% |
| West | $590 | +7% |
| U.S. average | $640 | -9% |
Cheaper gas nearly everywhere — except the West, where a much colder forecast than last year’s unusually warm winter overwhelms the price relief. The full mechanics of gas bills (therms, delivery vs. supply, winter rate seasonality) are in why is my gas bill so high.
Electric-heat homes — average winter spend by region
| Region | Total (Nov-Mar) | vs last winter |
|---|---|---|
| Northeast | $1,637 | -3% |
| Midwest | $1,380 | +3% |
| South | $1,079 | +3% |
| West | $1,151 | +9% |
| U.S. average | $1,196 | +4% |
Electric heat’s increase is price-driven (winter-average 18.23¢/kWh, up ~3%) rather than consumption-driven — the electric-side January spike mechanics (heating degree days, aux heat, estimated reads) are covered in why is my electric bill so high in January.
Propane and heating oil
| Fuel | Region | Total (Nov-Mar) | vs last winter |
|---|---|---|---|
| Propane | Northeast | $1,687 | -15% |
| Midwest | $1,305 | -4% | |
| South | $1,164 | 0% | |
| U.S. average | $1,246 | -3% | |
| Heating oil | U.S. average | $2,115 | +21% |
Oil is the story of the winter: global distillate refining has contracted, imports cost more, stocks entered the season low, and the Northeast’s milder forecast only partly offsets a 34% price jump. Oil-heated homes: the play is timing and efficiency, covered below.
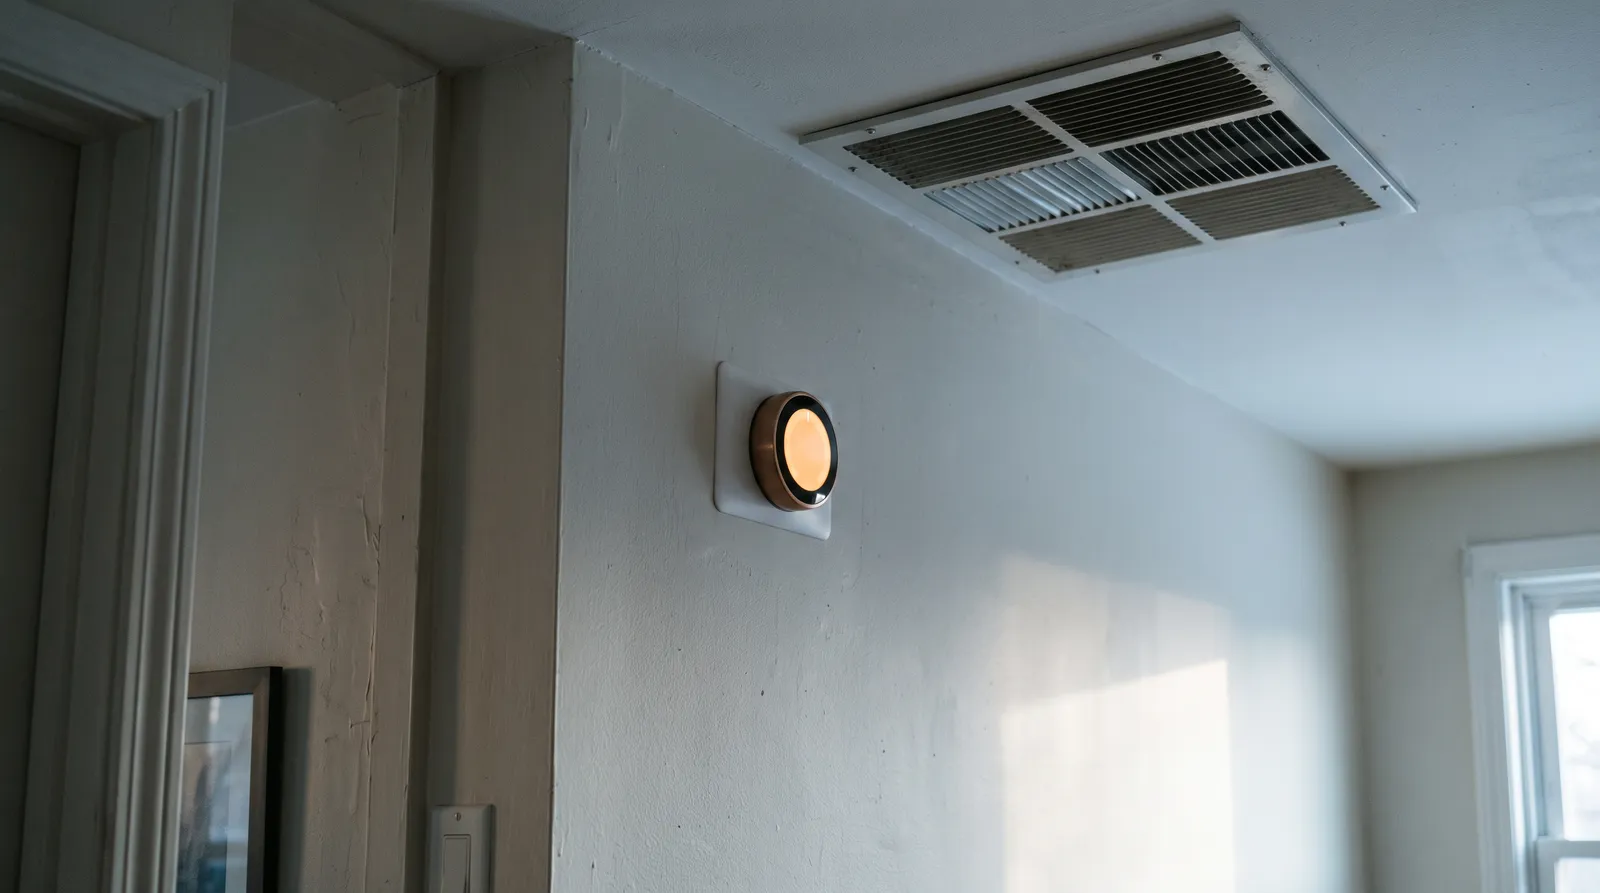
ENERGY STAR certified with smart recovery and energy reports — the automation layer that keeps an 8-13% setback schedule running through February, which is where electric-heat homes win this winter's forecast back. The mid-tier pick from our four-way comparison.
Check price on Amazon As an Amazon Associate we earn from qualifying purchases. Price & availability shown on Amazon.com.The Monthly Shape: January Is the Whole Game
| Fuel | Nov | Dec | Jan | Feb | Mar | Season |
|---|---|---|---|---|---|---|
| Natural gas | $111 | $140 | $146 | $128 | $116 | $640 |
| Electric heat | $213 | $253 | $270 | $230 | $230 | $1,196 |
| Propane | $201 | $274 | $302 | $251 | $218 | $1,246 |
| Heating oil | $360 | $465 | $509 | $420 | $361 | $2,115 |
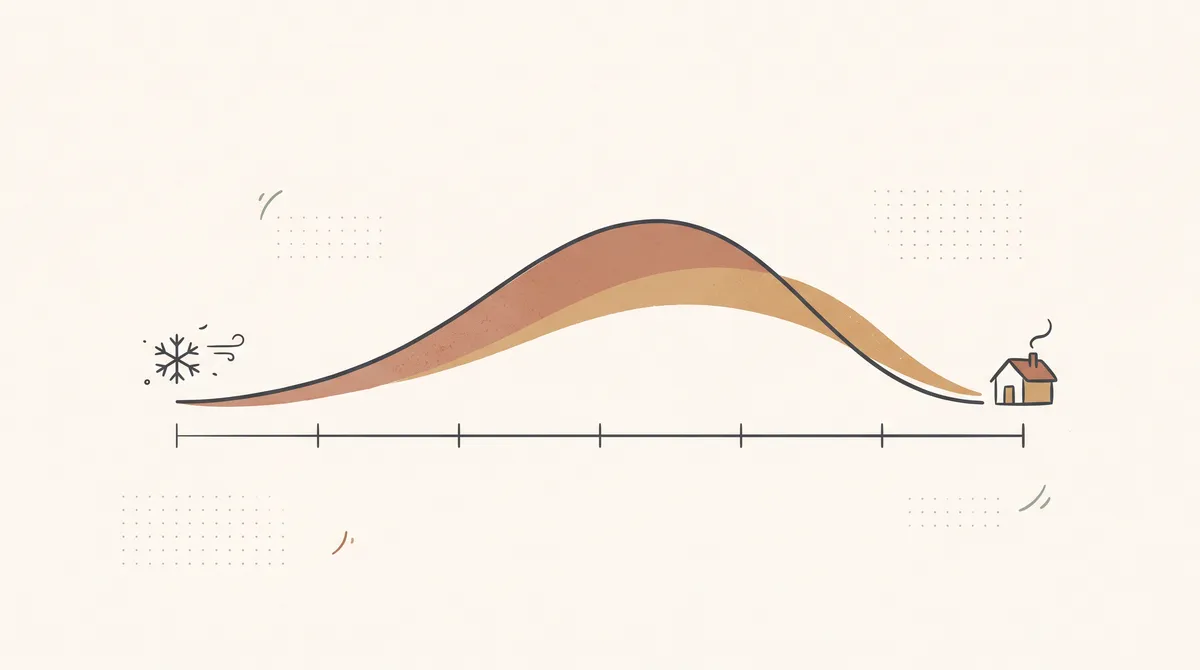
One number to internalize: heating-degree-day physics means January isn’t just the biggest bill, it’s the month where every efficiency measure pays at maximum rate. A setback schedule that saves ~10% saves it on the fattest base of the year — the settings live in what temperature to set your thermostat in winter. December has its own overlay: holiday lighting and guests, covered in Christmas lights electricity cost.
The Weather Caveat (Read Before Budgeting)
EIA’s forecast assumes national temperatures similar to last winter, warmer in the Northeast, much colder in the West, and it flags a strong El Niño — which historically produces large regional deviations from any smooth forecast. EIA publishes side cases for warmer and colder winters, and updates the whole outlook monthly alongside its Short-Term Energy Outlook. Treat these tables as the center of the distribution, not a promise: a February polar vortex moves every number on this page.
What to Do for Your Fuel
Natural gas (-9% expected): the cheapest winter you’ve had in a while — bank it. The furnace-side efficiency stack: fresh filter, furnace tune-up, thermostat schedule. If your furnace short-cycles, fix it now: why does my furnace keep turning on and off.
Electric heat (+4% expected): you’re on the wrong side of this year’s forecast, so the levers matter. In order: the setback schedule (worth ~8-13% on the heating share), a smart thermostat that actually maintains it, time-of-use shifting if your utility offers it (the TOU playbook), and — if you heat one room most evenings — the honest zone-heating math in is it cheaper to heat one room (electric-resistance homes are the one case where zone heating wins cleanly).
ENERGY STAR certified with smart recovery and energy reports — the automation layer that keeps an 8-13% setback schedule running through February, which is where electric-heat homes win this winter's forecast back. The mid-tier pick from our four-way comparison.
Check price on Amazon Price & availability shown on Amazon.com — we may earn a commission.Propane (-3% expected): the relief is price-side and regional (Northeast -15%). Fill timing still matters with delivered fuels — prices tend to soften outside the demand peak; don’t refill in the third week of January if you can avoid it.
Heating oil (+21% expected): the hard case. Every efficiency dollar pays back at $5.26/gallon: the same setback schedule, draft sealing, and tune-up stack, plus the delivered-fuel playbook — compare pre-buy/capped-price contracts against spot fills early in the season, ask your supplier about budget billing to flatten the January spike, and if a furnace replacement is genuinely on the table, run the heat pump vs. gas furnace math before committing to another oil cycle.
How EIA Builds This Forecast (Methodology, Honestly)
Understanding the machinery keeps you from over-trusting it. EIA starts from the October Short-Term Energy Outlook’s price paths for each fuel, layers on NOAA’s winter temperature forecast by region, and applies both to the per-fuel household population from its consumption surveys. The output is the expected consumption × price = expenditure table you read above, with side cases for warmer and colder winters. Three honest limitations: it models the AVERAGE home on each fuel (your house’s size, envelope, and equipment move you off-center); weather forecasts at seasonal range are probabilistic (El Niño tilts odds, it doesn’t issue guarantees); and prices for delivered fuels (oil, propane) vary locally far more than pipeline gas or grid electricity. Treat the table as the center of a distribution, check it monthly as EIA updates, and reconcile it against your own bill history — the method for reading YOUR bill’s usage-vs-rate split is the heating bill diagnostic’s framework.
Your Own Bill vs. the Forecast (The Reconciliation That Matters)
The forecast number is a national average for your fuel; your bill is your house. To see where you’ll land:
- Pull last winter’s bills (Nov-Mar). Sum the HEATING portion — for gas homes, roughly the winter total minus the ~$20-40/month summer baseline of water heating and cooking.
- Apply your fuel’s percentage from the headline table: gas homes ×0.91, electric-heat ×1.04, propane ×0.97, oil ×1.21 — then your region’s variant from the regional tables if it differs sharply (West-region gas homes ×1.07, for instance).
- Adjust for your own changes: new windows, a new thermostat schedule (the winter settings guide), a furnace replacement, or an extra person home all day move you off last year’s base by more than this forecast does.
- Budget the January spike: whatever your seasonal total, January runs roughly 23% of it (gas $146/$640, electric $270/$1,196, oil $509/$2,115). Level-payment/budget billing with your utility or fuel supplier flattens exactly this spike — worth setting up in November, not in January.
Delivered-Fuel Playbook (Oil and Propane Specifics)
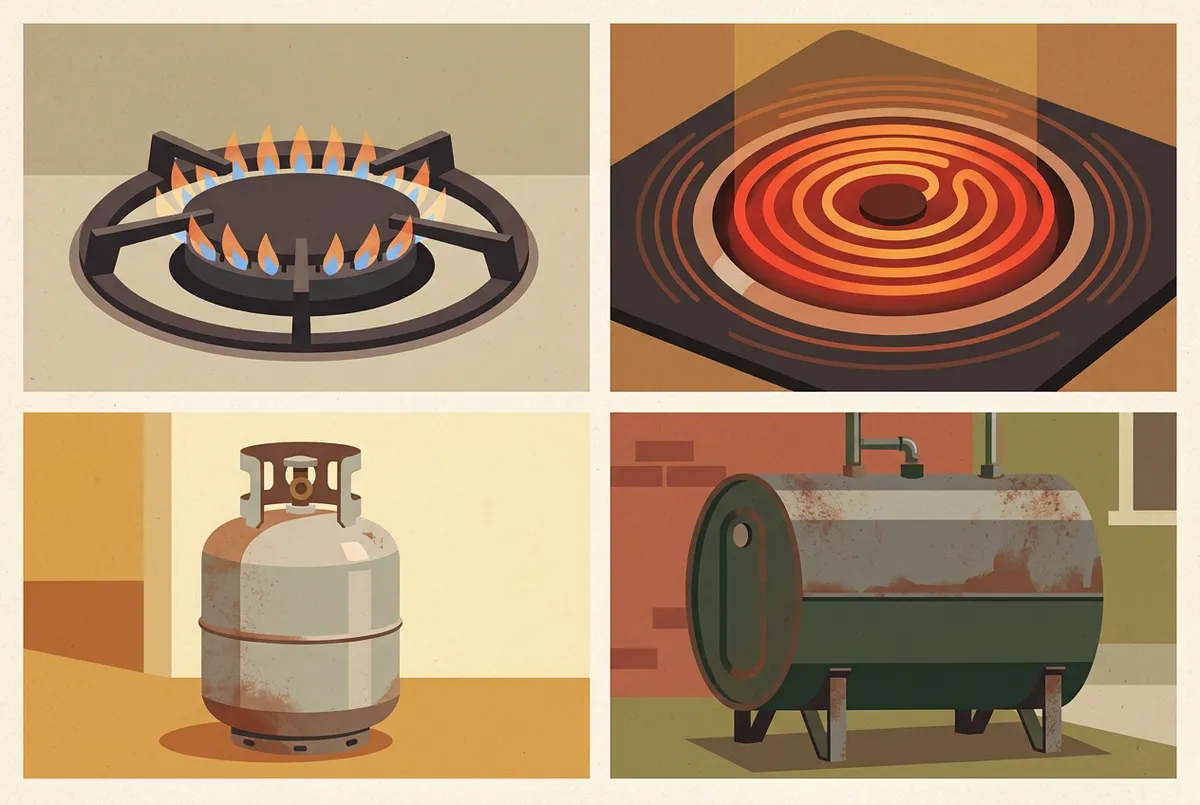
Homes with truck-delivered fuel have moves pipeline and grid homes don’t: pre-buy or capped-price contracts (locking a season price early — this year, locking BEFORE the winter was worth 21% on oil), budget billing with the supplier to flatten January, group/buying-cooperative pricing in some rural markets, and fill timing (spot prices tend to crest with demand in deep winter). The honest caveat for 2026-27: locks are insurance, not arbitrage — a warm winter can leave you having paid over spot. Size any lock so a mild-season regret is annoying, not painful.
Frequently Asked Questions
Will heating bills go down this winter?
What is the average winter heating bill in the U.S.?
Why is heating oil so expensive this winter?
Is this forecast reliable?
Which month has the highest heating bill?
When does EIA update this forecast?
Related: why is my gas bill so high, why is my electric bill so high in January, and what temperature to set your thermostat in winter.
Sources
- U.S. EIA — 2026-27 Winter Fuels Outlook (October 6, 2026) — all expenditure, price, and consumption tables on this page.
- U.S. EIA — Press release: mixed picture for winter fuel costs — headline percentages and context.
- U.S. EIA — Electricity Monthly, Table 5.03 — residential electricity rate context.
- Amazon — ecobee Smart Thermostat Essential listing — thermostat placement context (verified Oct 2026).