Quick Answer
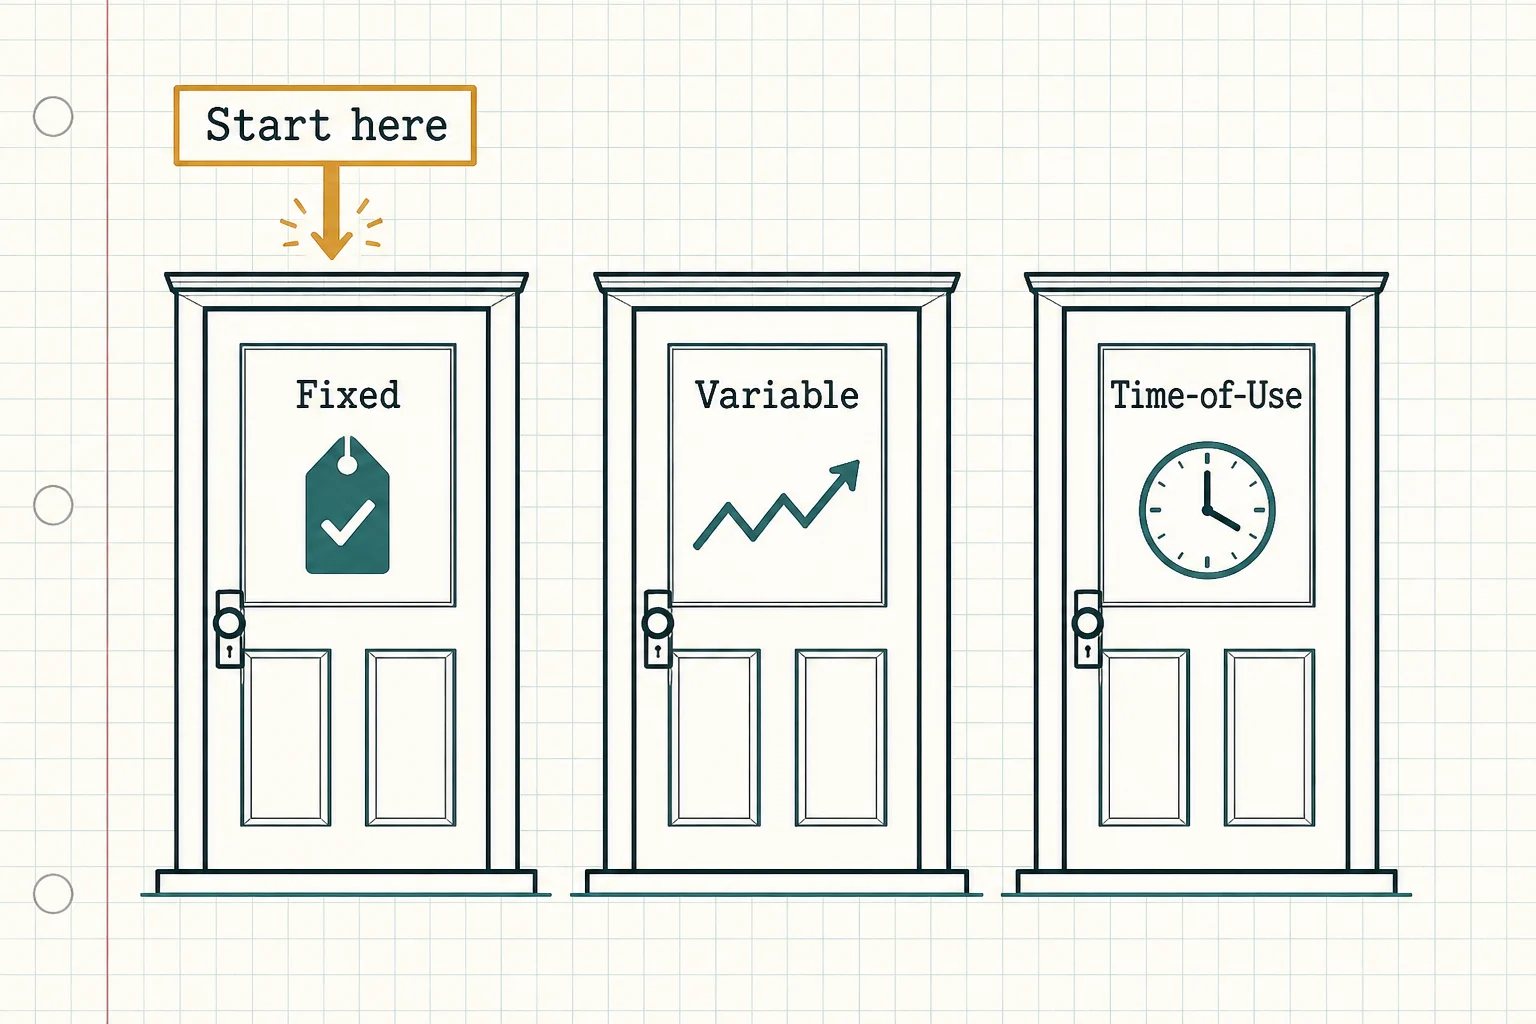
Match the plan to when you use power, not to the headline price. Predictable usage that resists scheduling fits a fixed rate; a household that can shift laundry, dishwashing, and EV charging to evenings and weekends earns real savings on time-of-use (ToU); deregulated-state shoppers who watch prices can gamble on variable, accepting that spikes arrive unannounced. Most households are best served by fixed or ToU — the two structures whose bills you can actually predict.
The Decision List
Answer these in order:
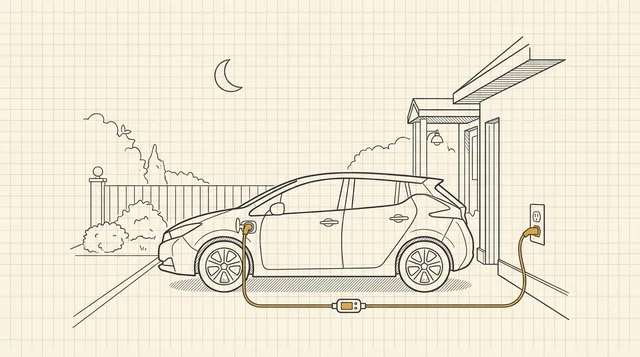
- Can you shift 20%+ of your usage out of weekday afternoons? (Laundry after 9pm, dishwasher delayed-start, EV charging overnight.) If yes → price a ToU plan against your current bill. If no → fixed.
- Is your usage seasonal-heavy? (Summer AC, winter heat.) Fixed rates smooth the per-unit price; ToU adds a second seasonal layer — check both summer and winter peak windows before switching.
- Do you live in a deregulated state? (TX, PA, OH, and a dozen others.) Then you can shop retail plans — compare real offers on your state’s official marketplace, not marketer sites, and read the fixed vs variable comparison with real offers.
- Does your utility bill a demand charge or tiered water/energy rate? Those change the math differently — see how demand charges work and how tiered rates work.
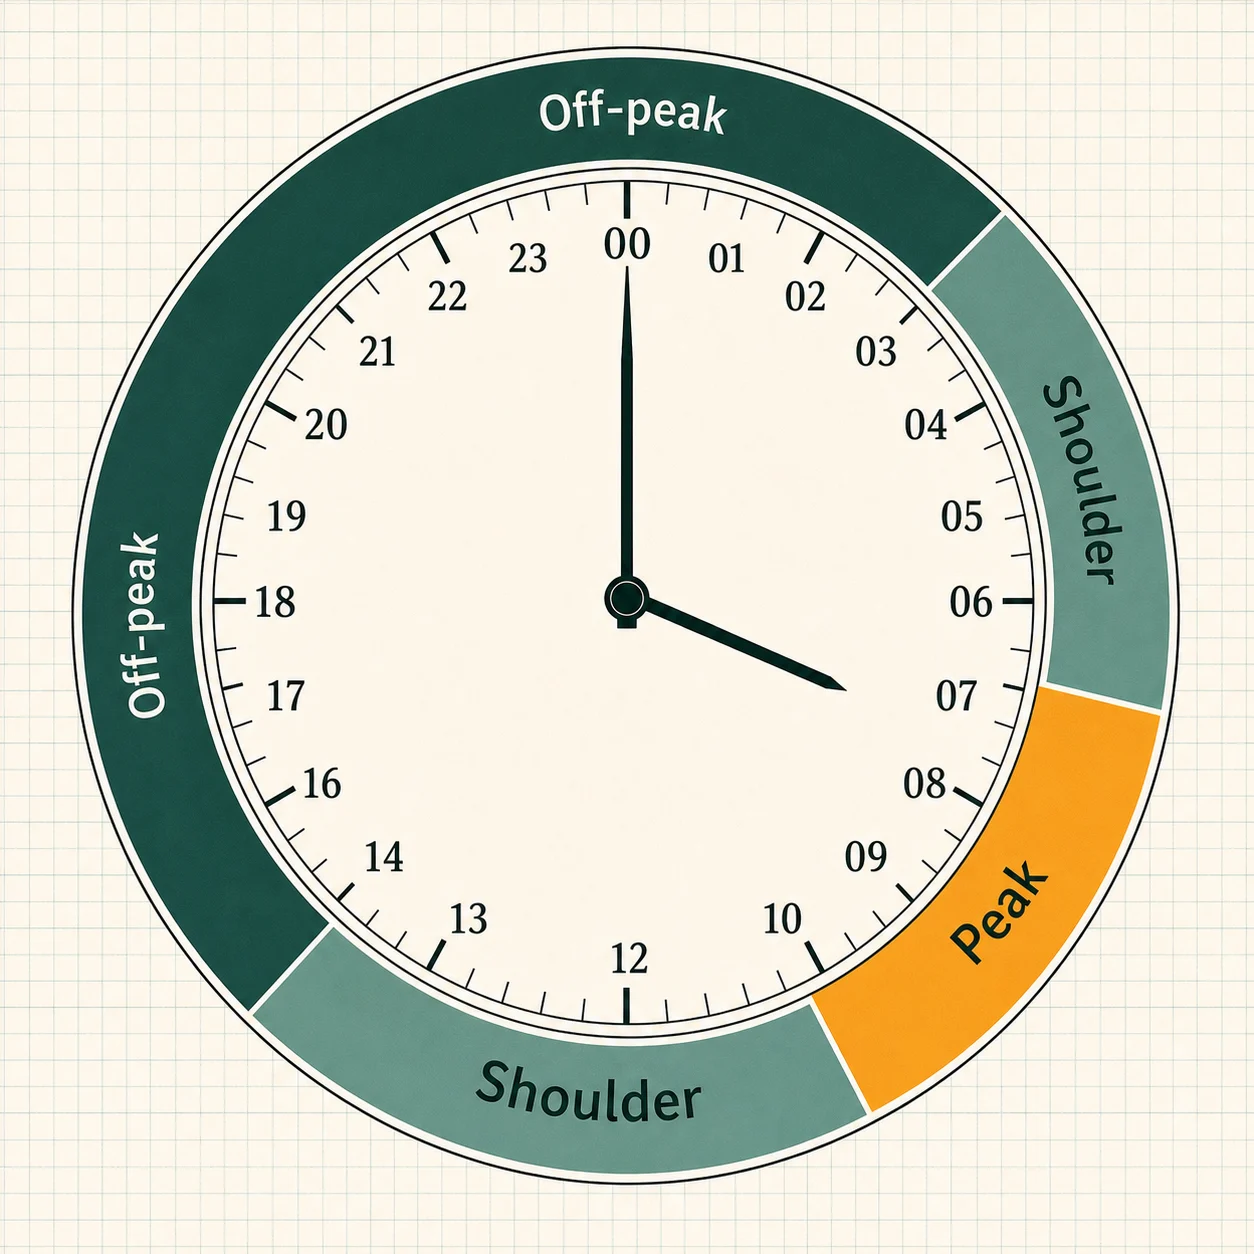
The Summer Trap: When a Good Schedule Fails One Afternoon
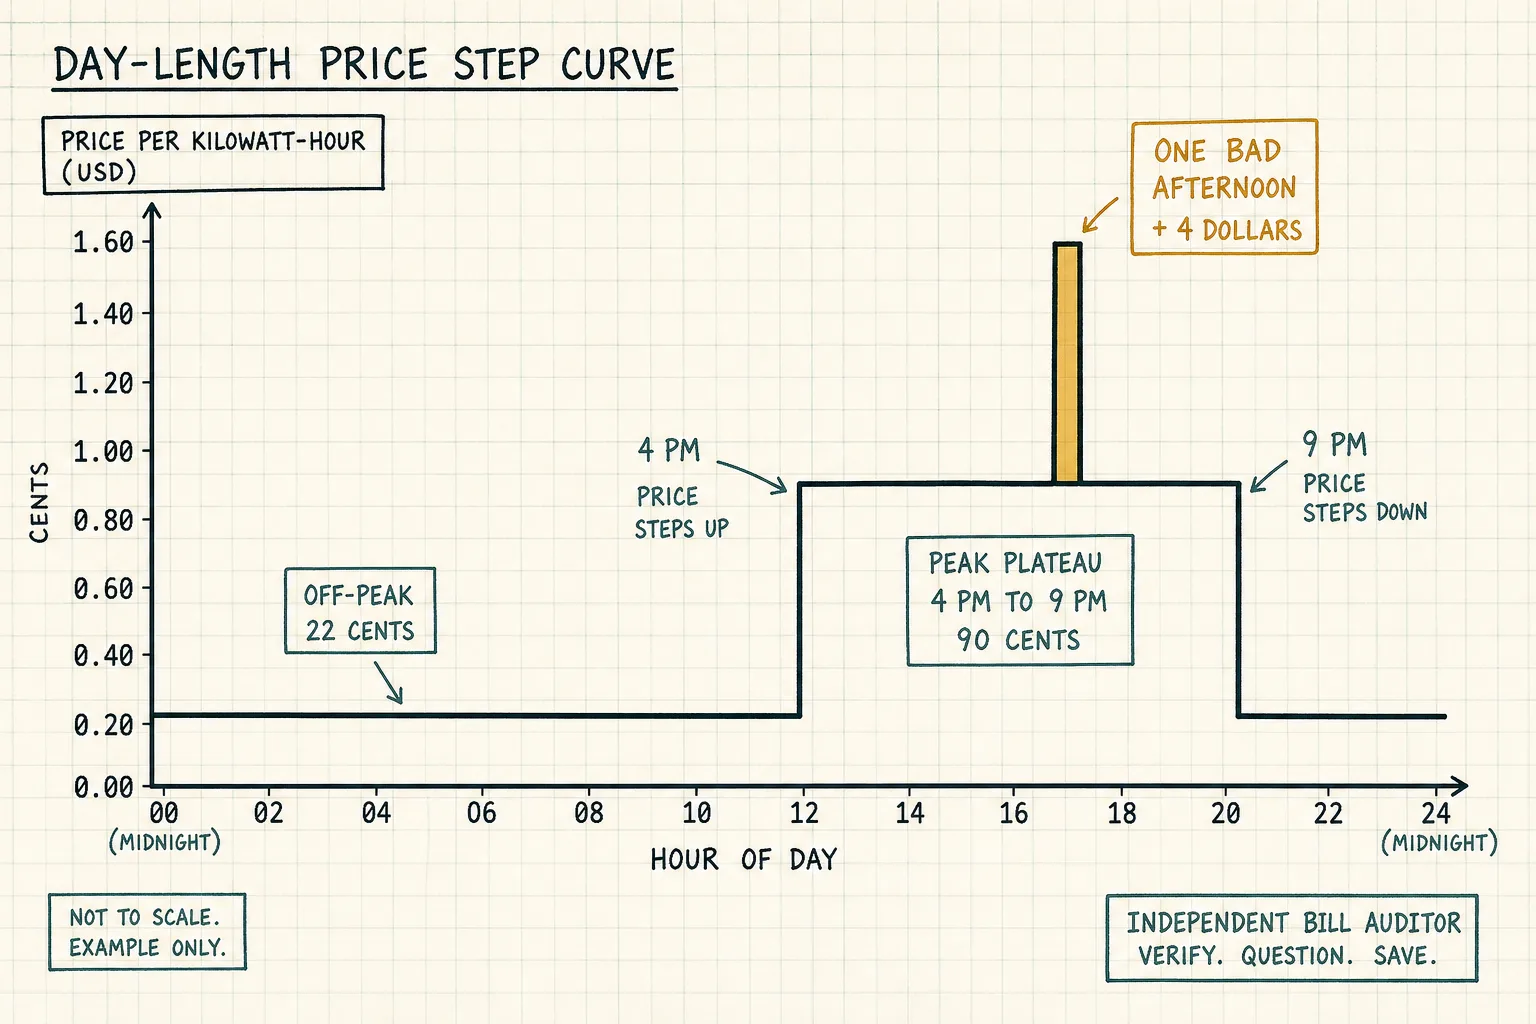
A plan can be right in March and still cost you money in August — not because the schedule was wrong, but because one afternoon refused to cooperate. Here is the failure mode with real numbers.
The setup: a shift-able household prices a TOU plan. The all-in spread below uses Con Edison’s published residential TOU rates for summer 2026 — 44.97¢ per kWh peak (supply + delivery) vs 22.33¢ off-peak, a 2:1 spread. Supply-only spreads run steeper: Con Edison’s own summer supply rates are 27.86¢ peak vs 5.22¢ off-peak (what time is electricity cheapest), about 5.3:1, and marketed plans land in between — so we show a mid-case 3:1 spread too (illustrative: a 22.33¢ off-peak price paired with a ~67¢ peak).
The booked month: laundry after 9 PM, dishwasher on delayed start, EV charging overnight — about 40 kWh a month shifted out of the peak window. At the 22.64¢ all-in spread, that is 40 × $0.2264 ≈ $9.06/month saved — roughly $109 a year, every month the schedule holds.
The one bad afternoon: an August heat wave. A sitter runs the dryer at 4 PM (4.5 kWh), the delayed-start dishwasher gets overridden for a dinner party (1.5 kWh), and the AC pre-cools hard through the peak window (12 kWh). Call it 18 kWh that were supposed to be off-peak and weren’t. Extra cost: 18 × $0.2264 ≈ $4.08 on the 2:1 plan; on a 3:1 spread, 18 × ~$0.45 ≈ $8.04 for the same slip.
The month nets about $5 saved on the 2:1 plan ($9.82 on the 3:1 variant) — roughly 45% of the booked savings erased by two or three hours of real life. That is the trap: not a wrong plan, but a savings figure quoted for a perfect month you will never live. Two rules fall out of the math:
- TOU pays for consistency, not perfection. One overridden afternoon erases about half a month’s booked savings; abandoning the schedule entirely erases the rest, month after month, until the plan’s edge is gone.
- Price your worst realistic week, not your average one. Before switching, pull 12 months of hourly usage (Question 4 below) and check what your busiest afternoons would have cost at peak rates. A plan that only works on quiet weekdays is a plan for someone else’s life.
How the Plan Types Compare
| Fixed rate | Variable rate | Time-of-use (ToU) | Tiered | |
|---|---|---|---|---|
| Price per unit | Locked for a term | Moves with market/month | Varies by time block | Rises past a usage threshold |
| Bill predictability | High | Low | Medium — predictable if schedule is stable | High until you cross the tier |
| Best for | Budgeters, stable usage | Price-watchers in deregulated markets | Shift-able schedules, EV owners, smart-home users | Conservation-minded, low-usage households |
| Main risk | Paying a premium when market prices fall | Winter/summer spikes hit unprepared | Afternoon AC or laundry erases savings | One hot month jumps a tier |
| Where explained | Fixed vs variable, real offers | same | Time-of-use rates explained | Tiered water rates |
Match the Plan to Your Usage Pattern
The comparison table says what each plan is; this one says what you should do:
| Your usage pattern | Fits best | The trap to price first |
|---|---|---|
| High daytime (home all day, summer AC) | Fixed | Your usage peaks exactly when TOU peaks — you’d pay premium rates for baseline life. |
| High evening (home after 5 PM) | Fixed, or a TOU plan whose peak window you’ve checked | Many TOU peaks run 4–9 PM; if your evening matches their peak, shift plans, not just loads. |
| Shift-able (laundry, dishwasher, charging can move) | ToU | Book the shift, then run the Summer Trap math above on your worst realistic afternoon. |
| EV, mostly overnight | ToU or an EV-specific rider | Off-peak windows exist for exactly this load — see how EV charging affects your bill, then confirm your utility’s window covers your charging hours. |
EV-overnight note: an EV can add more monthly kWh than the rest of the household combined — which is why how EV charging can affect your electric bill is the deepest worked example on this site of a load that wants a ToU structure.
Questions to Ask Your Utility Before Switching
- What rate plans am I currently eligible for, and what is the all-in per-unit price on each (energy + delivery + riders, not just the supply line)?
- Is there a fee to switch plans, a minimum term, or a seasonal window when switches are not allowed?
- For ToU: what exactly are the peak/off-peak windows, and do they change seasonally? (Utilities publish these in tariff sheets — for example, Pacific Gas & Electric’s E-TOU-C schedule defines its windows in its published tariff.)
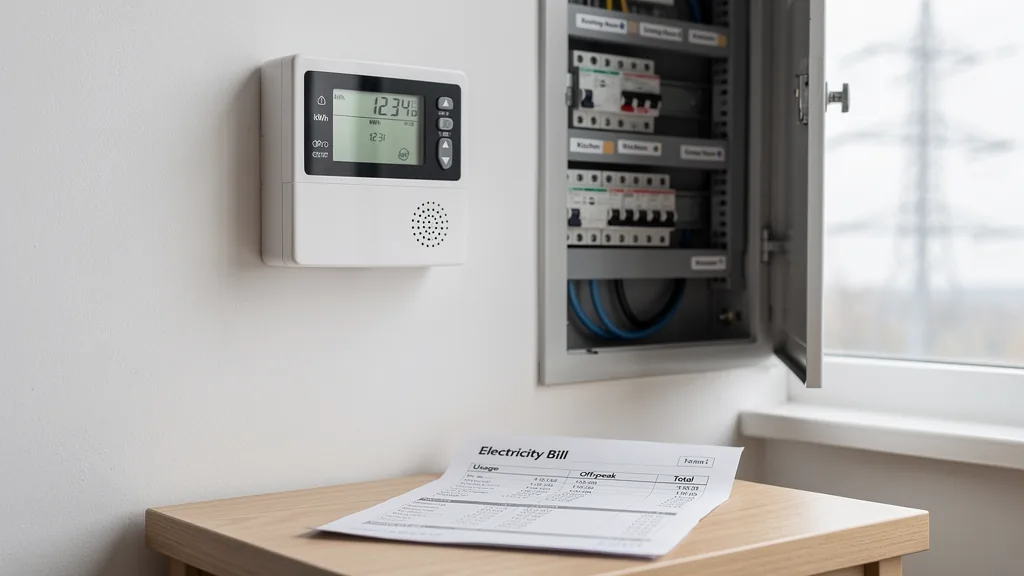
- Can I see my hourly usage data for the last 12 months to simulate what my bill would have been on each plan?
- Does net metering, a demand charge, or a minimum bill interact with the plan? (Net metering explained, minimum bills.)
That fourth question is the one most readers skip — and the one that turns a guess into a calculation. The national average residential price was about 18.3¢ per kWh in mid-2026 (U.S. EIA), but your all-in local rate is the only number that matters for this decision.
Every Rate Page on This Site
- Fixed vs variable rates — real TX/PA/OH offers
- Time-of-use electricity rates explained
- What time is electricity cheapest?
- Demand charges on an electricity bill
- Tiered water rates explained
- Net metering explained
- Delivery charge vs supply charge
- Understanding kWh — the unit behind every plan
Read This Before You Sign
Plan choices are commitments. A fixed or ToU plan is typically a 12-month commitment — run the worst-case math (your busiest peak-window day, not your average day) before signing, and check any early-termination fee in the fixed vs variable comparison. Rates, windows, and terms vary by utility and state; this page is educational, not financial advice.
After You Pick: Make the Plan Pay
A rate plan is a pricing structure, not a savings plan — the savings come from matching behavior to it. Once your structure is right, how to lower your utility bills walks the prioritization: measure first, then fix the biggest line.