Quick Answer
Standby power is electricity a device uses while connected to mains power in its lowest-power state — often when it appears off or is not performing its primary function. DOE says it can be a significant part of a product’s energy use.[1][2]
Identify devices that use power in low-power modes, then decide which can safely be switched off between uses. Do not cut power to equipment that needs to remain on, such as refrigeration or equipment that must retain a connection or setting.[3]
Standby Power by Device Class
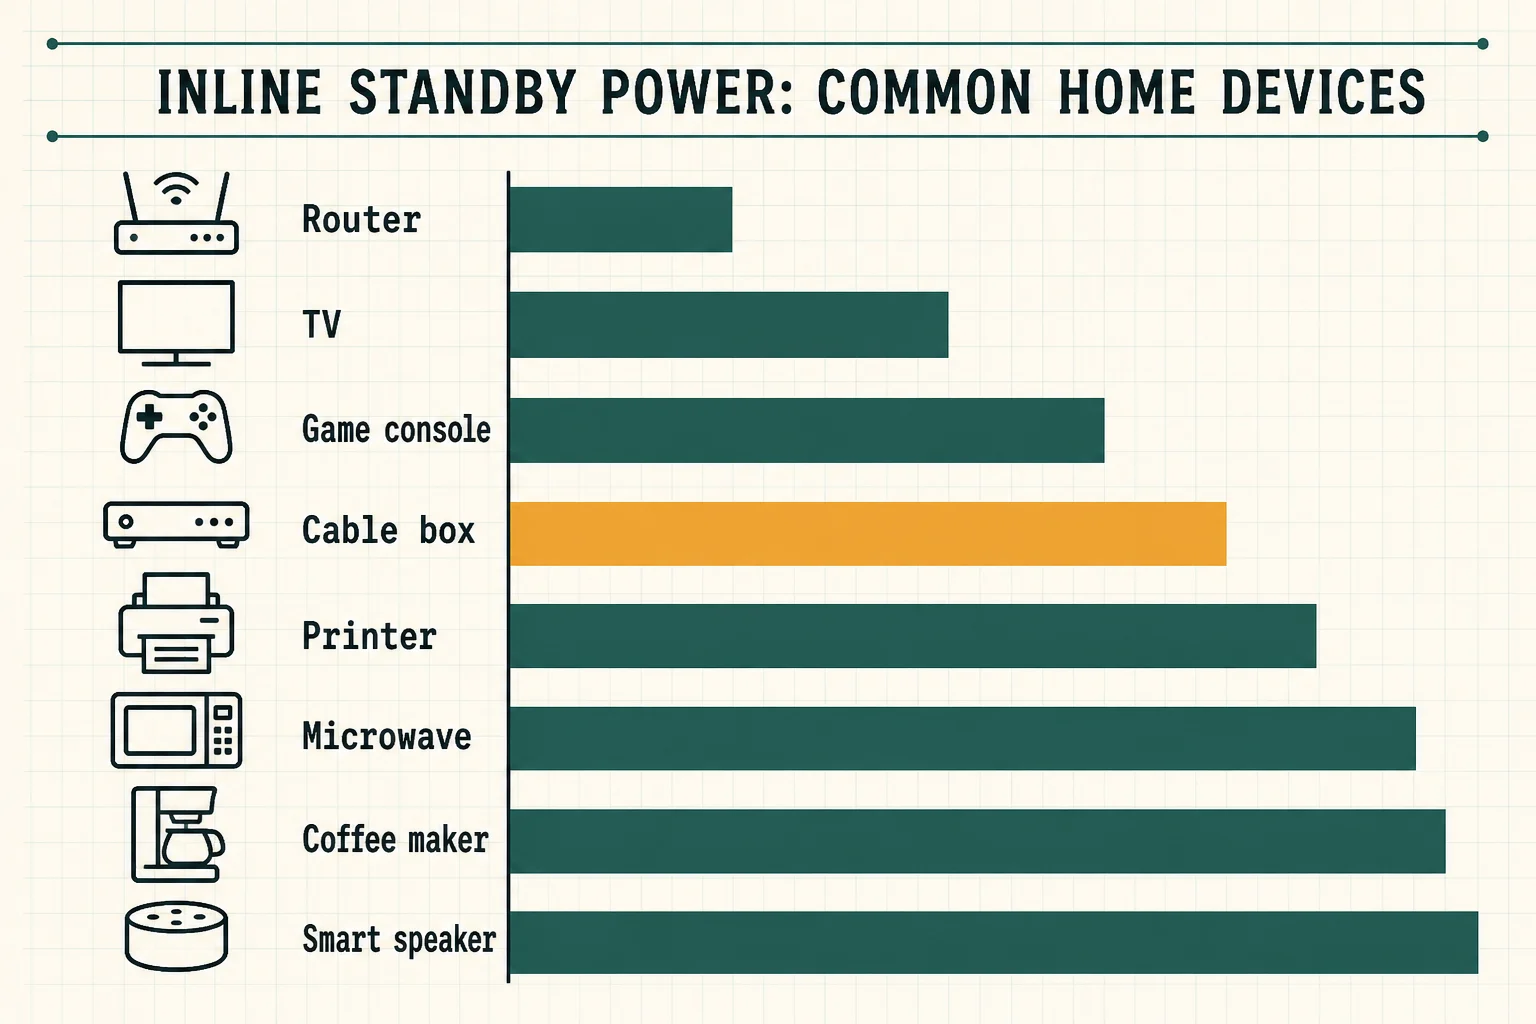
The following table shows typical standby power ranges for common household device classes. Figures are based on manufacturer specifications, DOE standby-power testing guidance, and measurements compiled by the California Energy Commission and referenced in international standby-power standards. Per the IEA One Watt Initiative (launched 1999), most devices sold after 2010 are designed to draw 1 W or less in standby, though older equipment and devices that maintain network connections (cable boxes, game consoles) may draw significantly more.
| Device Class | Typical Standby Power | Approx. Yearly Cost (18.4¢/kWh) | Notes |
|---|---|---|---|
| Modern LED TV (post-2015) | 0.3–1.0 W | $0.48–$1.60 | ENERGY STAR models typically <0.5 W; instant-on feature may increase to 1 W |
| Older LCD/plasma TV (pre-2010) | 3–10 W | $4.80–$16.00 | No longer ENERGY STAR current spec; remote receiver and display consume more |
| Cable/satellite set-top box (HD DVR) | 15–35 W (always on, not true standby) | $24.00–$56.00 | Most cable boxes never enter standby; they maintain guide data, DVR recording, and network connection |
| Streaming device (Roku, Fire TV, Apple TV) | 1.5–3.5 W | $2.40–$5.60 | Some stay in active standby to support voice commands / HDMI-CEC; sleeping models draw <1 W |
| Game console (PS5, Xbox Series X) — standby/connected | 1.5–4.0 W | $2.40–$6.40 | When in “connected standby” for controller charging / updates; turn off instant-on to reduce to <1 W |
| Game console (older) — standby | 2–8 W | $3.20–$12.80 | Older power supplies less efficient; disc-spin and network check cycles |
| Desktop computer (sleep mode) | 1–6 W | $1.60–$9.60 | Varies by power supply idle draw, Wake-on-LAN enabled, USB charge ports active |
| Laptop (plugged in, powered off / sleep) | 0.5–3.0 W | $0.80–$4.80 | Modern chargers drop to near-zero when laptop battery is full and device powered off |
| Monitor (sleep mode) | 0.3–1.5 W | $0.48–$2.40 | ENERGY STAR monitors ≤0.5 W in sleep; older models up to 5 W |
| Wi-Fi router/modem | 5–15 W (always on) | $8.00–$24.00 | Cannot be turned off if internet service needed; some models have lower-power modes |
| Smart speaker (Alexa, Google, HomePod) | 2–4 W (always listening) | $3.20–$6.40 | Always-on microphone processing; “off” button if present disconnects mains via internal relay |
| Microwave oven (clock display, controls) | 2–5 W | $3.20–$8.00 | Digital clock and control board draw power constantly; no true standby |
| Coffee maker (programmable) | 1–4 W | $1.60–$6.40 | Analog switch models: 0 W when switched off; programmable models: 1–3 W |
| Phone/laptop charger (plugged, nothing attached) | 0.05–0.5 W | $0.08–$0.80 | Modern chargers with no-load detection draw negligible power; older wall warts up to 1 W |
| Laser printer (idle/ready) | 5–15 W | $8.00–$24.00 | Fuser heater cycles to maintain standby temperature; ENERGY STAR models ≤5 W |
| Inkjet printer (off/idle) | 0.5–2.0 W | $0.80–$3.20 | Most drop below 1 W when powered off |
Cost calculation: 1 W × 24 h × 365 days × 18.4¢/kWh = ~$1.61/year per watt. Figures shown use that rate; your cost = (your watts × 8,760 hours × your ¢/kWh) ÷ 1,000.
Total Typical Home Math
How much phantom power does a typical home waste? The Wikipedia compilation of standby-power studies reports that before the One Watt Initiative standards took full effect, standby consumption ranged from 32 to 87 watts per home — accounting for 3–10% of total residential electricity use.[4]
A more realistic modern estimate (post-2013 standards) for a home with typical electronics:
| Device | Standby/Low-Power Draw | Number in Home | Total Watts |
|---|---|---|---|
| Smart TV (modern) | 0.5 W | 2 | 1.0 W |
| Cable box (always on) | 20 W | 1 | 20.0 W |
| Streaming device | 2.5 W | 1 | 2.5 W |
| Game console (standby) | 3 W | 1 | 3.0 W |
| Desktop PC (sleep) | 3 W | 1 | 3.0 W |
| Wi-Fi router/modem | 10 W | 1 | 10.0 W |
| Microwave | 3 W | 1 | 3.0 W |
| Coffee maker (programmable) | 2 W | 1 | 2.0 W |
| Smart speaker | 3 W | 2 | 6.0 W |
| Laptop charger (plugged) | 0.5 W | 2 | 1.0 W |
| Total standby draw | 51.5 W |
At 18.4¢/kWh, 51.5 W continuous = 51.5 W × 8,760 h = 451 kWh/year × $0.184 = $83/year. Not all of this can be eliminated — the router, smart speakers, and cable box must stay on for their primary function — but 20–30 W ($32–$48/year) is typically addressable with power strips, timer switches, or device settings changes.
How to Measure Your Home’s Standby Draw
A plug-in power meter is the only way to know what a specific device draws in standby — label wattage and ENERGY STAR ratings are for normal operation, not low-power modes. Follow these steps:
Plug the meter into the wall outlet and the suspect device into the meter. The Kill A Watt P4400 (linked below) reads real-time watts, volts, amps, and cumulative kWh with 0.2% accuracy per the manufacturer.
Put the device in its lowest power state — the mode it sits in most of the time when not actively used. For a TV, that is “off” but still connected to remote control. For a microwave, it is the clock display. For a game console, it is the “instant-on” or connected standby mode.
Let the reading stabilize. DOE advises measuring energy over a period and dividing by the measurement time if the reading fluctuates.[1] Variable loads (like a printer that cycles its fuser) need at least 30 minutes of cumulative energy measurement.
Log the result for each device. Note whether the load is intermittent or constant.
Decide what is addressable. Devices that need 24/7 power — router, security system, DVR that must record — stay on. Devices where you can cut power between uses — entertainment-center components, guest-room TV, printer — are candidates for a switched strip or smart plug.
Automate the Fix: Smart Plugs and Advanced Power Strips
Once you have measured which devices waste standby power, automation removes the hassle of unplugging and replugging. Two approaches:
Advanced power strips — DOE’s Better Buildings program describes these as having master and controlled outlets.[3] Plug the computer or TV into the master outlet; when it draws less than a set threshold (for example, 15 W for 5 minutes), the strip cuts power to the controlled outlets (monitor, speakers, printer). This requires no app, no scheduling, no manual action.
Smart plugs with scheduling — Wi-Fi or Matter-enabled outlets like the Kasa KP115 (linked below) turn off and on from an app or a set schedule. For example, set a plug to cut power to a cable box and soundbar at 11 PM and restore at 6 AM. The Kasa KP125MP2 (2-pack) adds Matter compatibility for cross-platform automation with Amazon Alexa, Google Home, and Apple Home.
Important: Do not automate power to devices that require a controlled shutdown (desktop computers, DVRs that are recording) or that need power for safety (refrigeration, medical devices, alarm systems, garage door openers — check manufacturer instructions).
Ways to Reduce Avoidable Standby Use
- Unplug a device when its low-power functions are unnecessary and it is safe to disconnect.[1]
- Use a switched power strip for peripherals you want to turn off together.[3]
- Consider an advanced power strip for a workstation or entertainment setup. DOE describes models that can turn off dependent outlets after a master device powers down while keeping designated always-on outlets energized.[3]
- When replacing a product, compare standby performance and manufacturer guidance.[2]
- Device settings matter: Many game consoles, computers, and smart TVs have “quick start” or “instant-on” features that keep them in a higher-power standby. Disabling these — accepting the extra 5–15 second boot time — can reduce standby draw by 50–80%.
Put Savings in Context
A device’s cost depends on its measured power use, the time it stays in that mode, and the electricity price on your utility bill.[1] Calculate your household result from the meter reading and your own rate rather than using a universal dollar estimate. Standby power is also one of the levers that works with no solar panels and no big equipment swaps — our guide to lowering your electric bill without solar collects the full no-panels playbook.
The electricity usage monitor the article describes. Plug any device into it and read real-time watts, volts, amps, and cumulative kWh — the DOE-recommended method for finding standby loads.[1]
Check price on Amazon Price & availability shown on Amazon.com — we may earn a commission.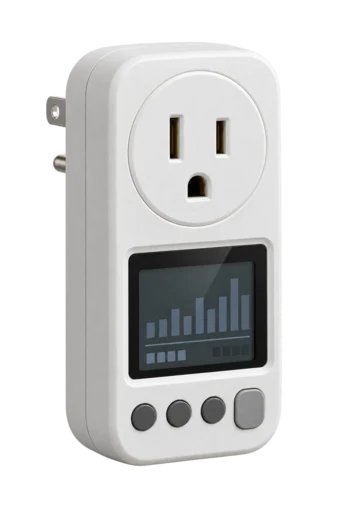
After the Kill A Watt identifies which devices waste standby power, replace the regular plug with this Wi-Fi outlet. Its Kasa app reports ongoing consumption and can schedule shut-off for devices that don't need 24/7 power — the same approach DOE recommends for reducing avoidable standby use.[1]
Check price on Amazon Price & availability shown on Amazon.com — we may earn a commission.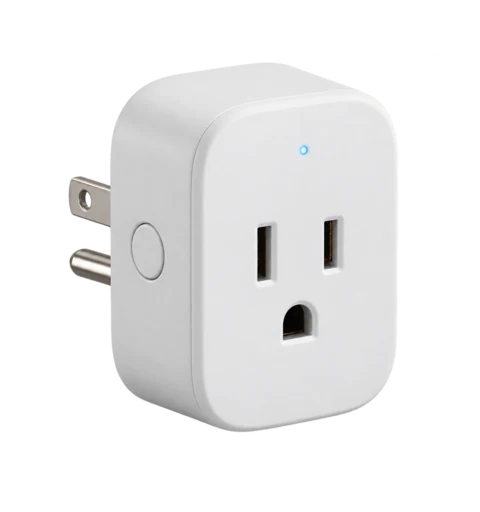
For a broader household review, see how to lower utility bills and how to read your electric bill.
Phantom load is one line of the full savings workflow — see how to lower your electric bill: the complete guide.
To measure the loads in this article: Kill A Watt alternatives covers the plug-in meter class, and which smart plugs measure energy the automated one.
Sources
- U.S. Department of Energy: Measuring Standby Power
- U.S. Department of Energy: Low Standby Power Products
- U.S. Department of Energy Better Buildings: Advanced Power Strips
- Wikipedia: Standby Power — Magnitude (cites 32–87 W/home, 3–10% of residential consumption, studies from California Energy Commission, IEA, and national energy agencies)
- ENERGY STAR: Electronics