Quick Answer
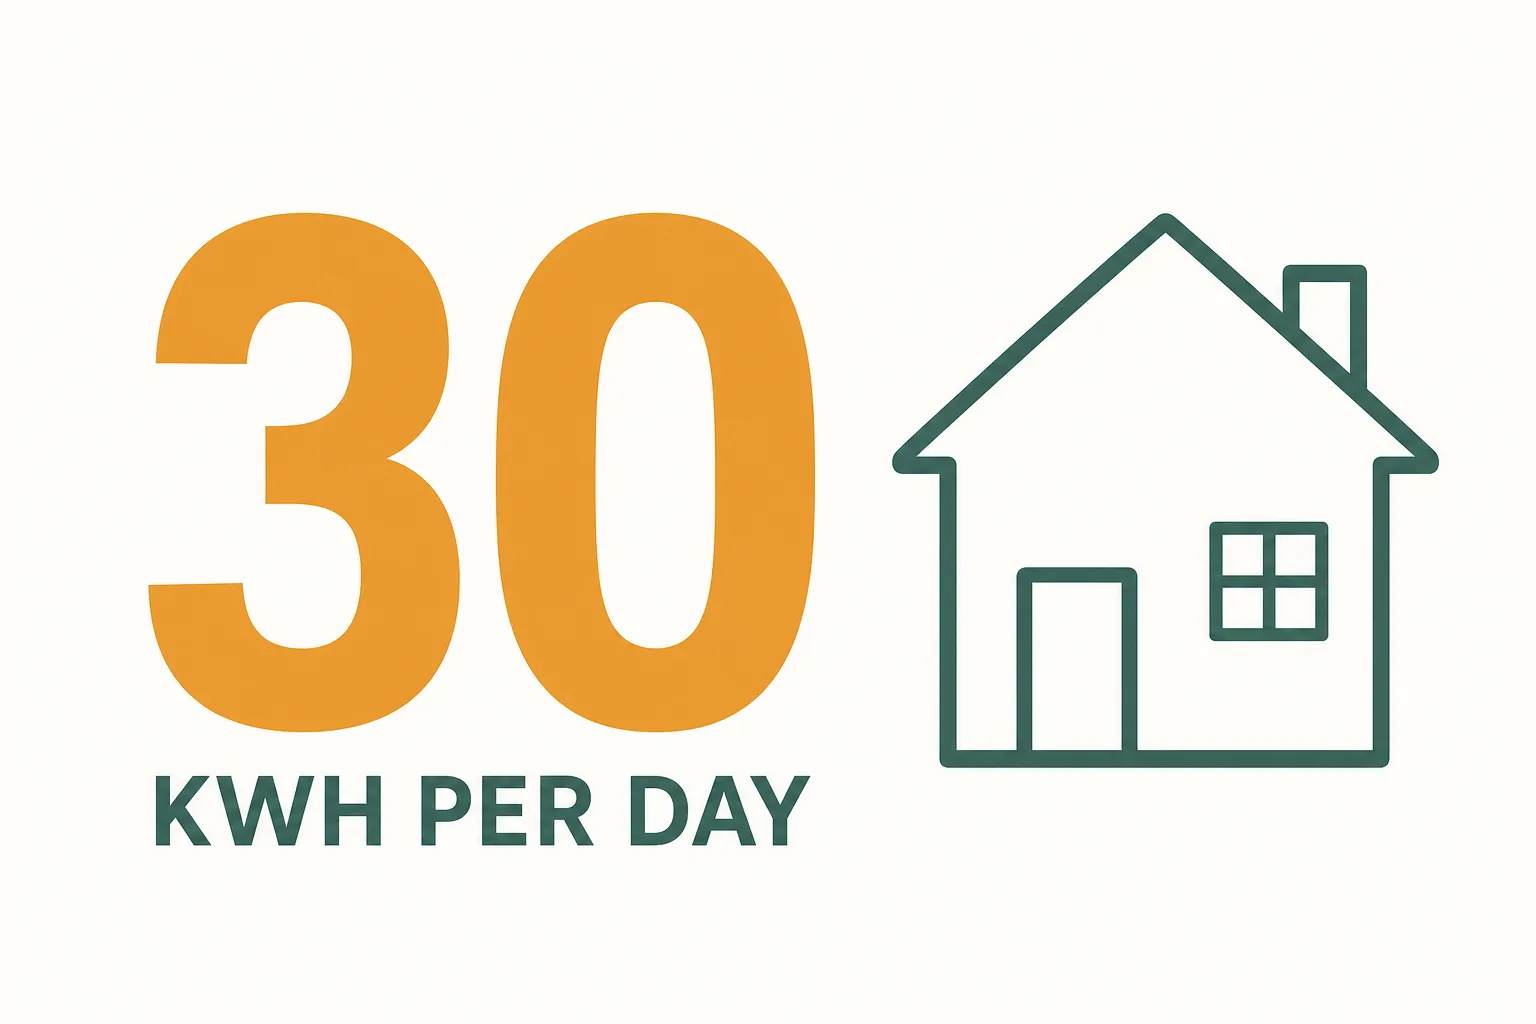
The average US house uses about 30 kWh of electricity per day — about 899 kWh/month, per EIA data. [1] That national average blends every home size, climate, and heating fuel, so treat it as a midpoint rather than an expectation: small gas-heated apartments can run half of it, while large all-electric homes in hot climates routinely go two to three times higher. [1]
What the National Average Actually Says
The U.S. Energy Information Administration (EIA) reports that in 2022, the average US residential electric-utility customer purchased 10,791 kWh for the year — an average of about 899 kWh/month, or roughly 30 kWh per day. [1]
That 30 kWh/day number is worth having, but it hides the two extremes behind it. Hawaii averaged 6,178 kWh per residential customer for the year, about 17 kWh per day. Louisiana averaged 14,774 kWh, about 40 per day. [1] Nearly a two-and-a-half-fold spread between the lowest and highest states comes down mostly to climate and heating fuel — a preview of everything that decides your own number.
It is also worth knowing what that average does not include. Electricity is not the only energy source in most homes: retail electricity covered about 44% of residential end-use energy in 2020, and natural gas about 43%. [2] A house with gas heat, gas water heating, and a gas stove runs a large share of its energy bill through the gas meter entirely — so its daily kWh can look modest while the total utility bill does not.
What Pushes a Home Above or Below the Average
Home size and building envelope. More square footage means more lights, more appliances, and more air to condition. Older, leakier homes also pay a conditioning penalty in every season — drafts and thin insulation make the heating and cooling share of the bill bigger than it needs to be.
Climate. Space heating and air conditioning are the seasonal, energy-intensive end uses, and they vary significantly by geographic location. [2] This is the main reason the state extremes above look the way they do. [1]
Heating and cooling share. On average, more than half — 52% in 2020 — of a household’s annual energy consumption went to just two end uses: space heating and air conditioning. [2] If your home heats with electricity, winter months can easily run two to three times a mild shoulder-season month. Water heating, lighting, and refrigeration — year-round loads — accounted for another 25%, and everything else (TVs, cooking, laundry, electronics) for about 23%. [2]
Electric vs. gas appliances. Natural gas was used in 58% of US homes in 2020. [2] Where gas covers space heating, water heating, and drying, those loads never touch the electric meter. An all-electric house of the same size shows a higher daily kWh number by construction — same household work, different meter. If your bill shows therms alongside kWh, our Mcf vs. Ccf vs. therms explainer untangles the gas units.
EV charging. A plug-in vehicle adds a car-sized load to the meter. At a typical 3–4 miles per kWh, 35 miles of daily driving adds roughly 9–12 kWh per day — around $1.65–$2.15 per day at the national average price below. Two EVs, double it. For the meter-level math, see our EV charging impact guide.
Typical Daily kWh by Home Profile
The ranges below are illustrative: they apply EIA end-use shares — heating and cooling at 52% of household energy, on top of the 899 kWh/month national average [1][2] — to common home profiles. They are not measured per-profile averages, and a specific home can fall outside them.
| Home profile | Typical daily kWh | What drives the range |
|---|---|---|
| Apartment, 1–2 people, gas heat and hot water | 15–25 | No central AC or a single window unit; heating and water heating stay off the electric meter. |
| Small single-family home, gas heat | 20–35 | Central AC in summer; electric loads drop back in winter when the furnace takes over. |
| Medium single-family home, electric cooling and appliances | 30–50 | AC dominates summer usage; gas heat keeps cold months modest on the electric side. |
| Large all-electric home with EV | 40–70+ | Electric space heating is the big add; ~9–12 kWh/day of EV charging pushes the top of the range. |
For unit conversions across bills: 1 therm of natural gas equals 100,000 Btu, and 1 kWh equals 3,412 Btu. [3] At the national average electric price, one therm-equivalent of electric heat costs about $5.38, against typical delivered natural gas prices of roughly $1.35–$1.92 per therm in recent EIA data — the core economics behind the heat pump vs. gas furnace decision.
Your Daily kWh, in Dollars
EIA’s Electric Power Monthly put the June 2026 US average retail electricity price at 18.34¢/kWh. [4] Price spreads by state are enormous, but national-average math is a fair start:
| Daily kWh | Per day | 30-day month | Rough profile |
|---|---|---|---|
| 15 kWh | $2.75 | $82.53 | Low-usage apartment, gas heat |
| 20 kWh | $3.67 | $110.04 | Small home, mild climate |
| 25 kWh | $4.58 | $137.55 | Typical apartment or small home |
| 30 kWh (US avg) | $5.50 | $165.06 | National-average usage |
| 40 kWh | $7.34 | $220.08 | Medium home, electric cooling |
| 55 kWh | $10.09 | $302.61 | Large home, electric heat plus EV |
| 70 kWh | $12.84 | $385.14 | High end, all-electric large home |
The national-average month — 899 kWh/month at 18.34 cents — lands at about $165. [1][4] If your bill sits well above the row that matches your home profile, the next section tells you which number to trust.
How to Read Your Own Number
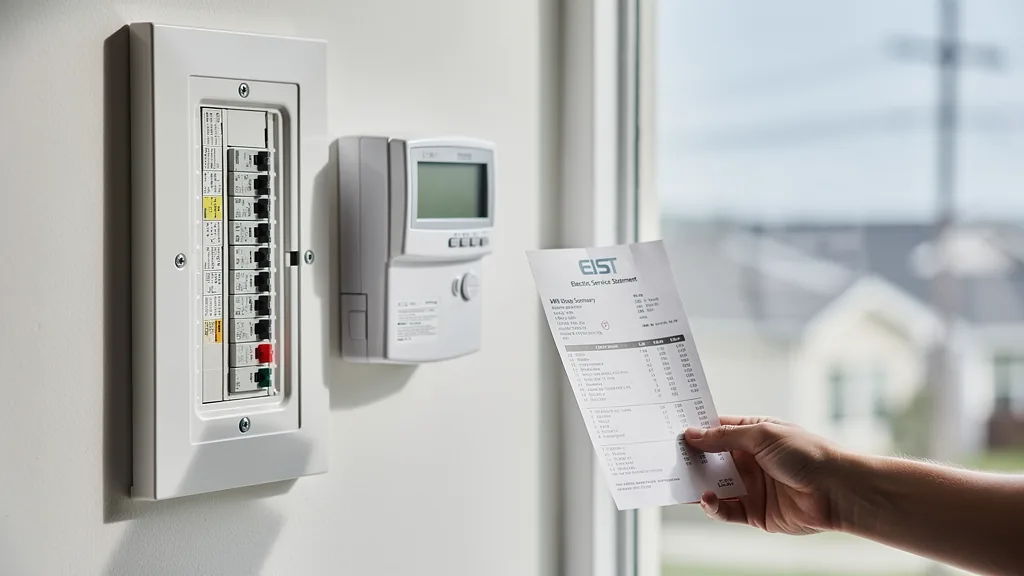
Your electric bill shows kWh for the whole billing cycle. Divide by the days in the cycle and you have your daily average — the number this article compares against. How to read your electric bill walks through finding it.
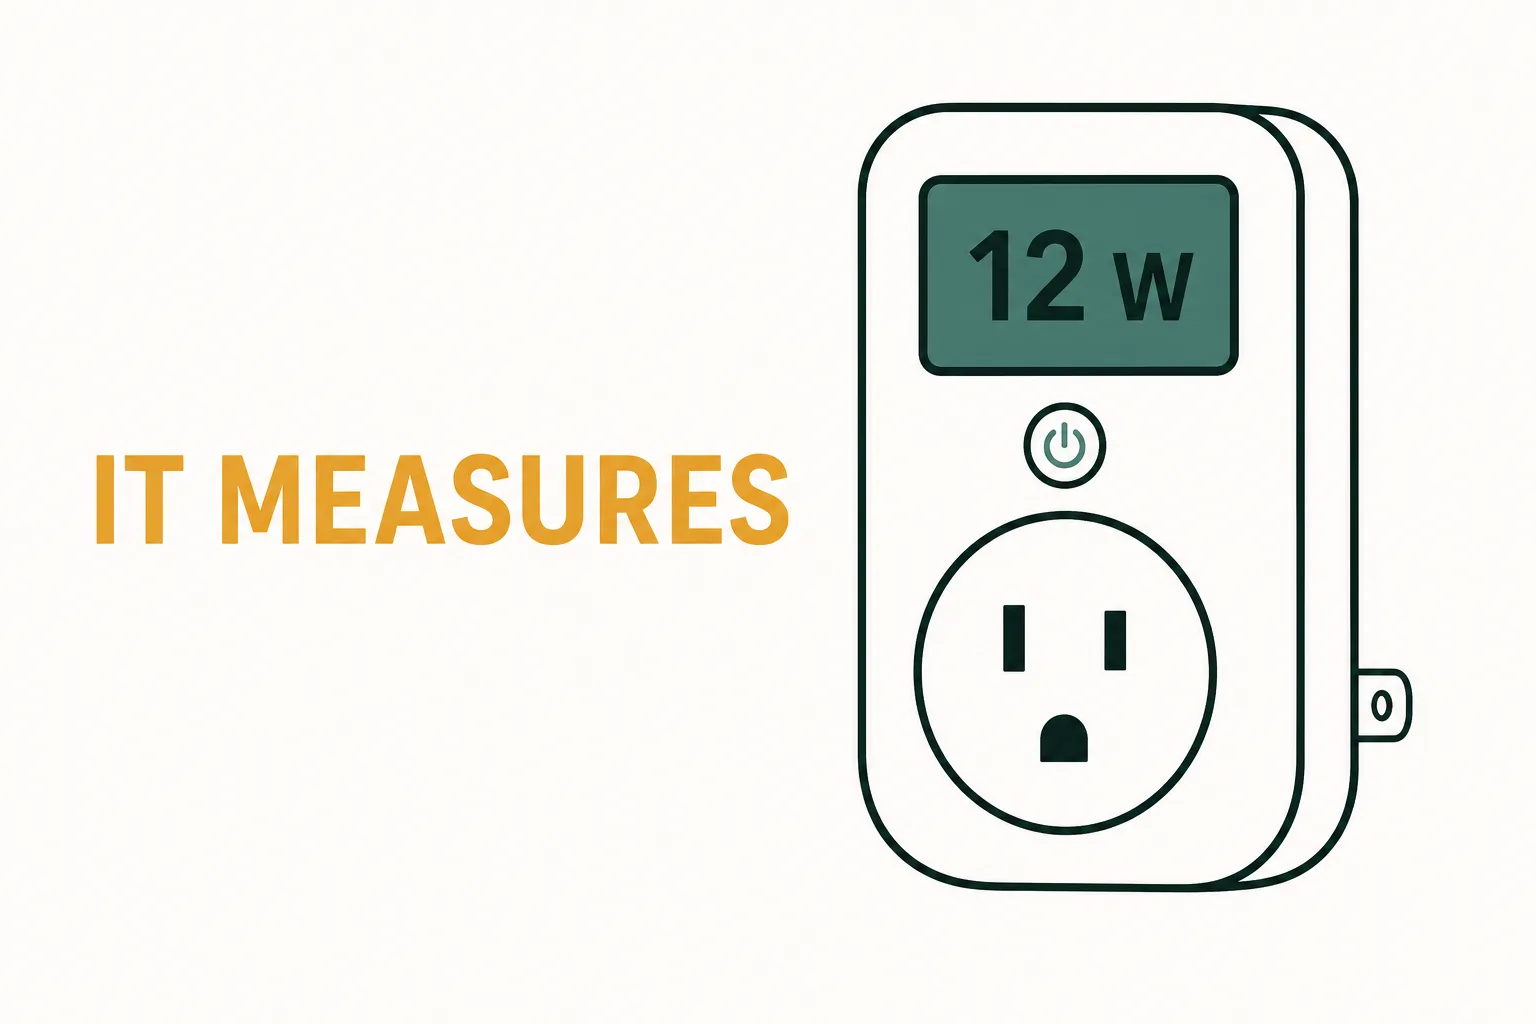
Two habits make that number meaningful. First, compare the same season year over year, not summer against spring: heating and cooling are seasonal by nature. [2] Second, lean on the meter itself — modern smart meters and inexpensive home energy monitors can show your daily average directly, so you are not guessing from one bill.
If your daily average is far above 30 kWh, work down the levers above in order of size: conditioning first (that 52% share), then water heating, then everything else. Our complete guide to understanding your utility bill covers where each usage figure lives on the page.
How to Lower a High Daily Average
- Treat heating and cooling as the main lever. They are the majority of household energy use. [2] Thermostat discipline, filter changes, and sealing drafts do more than any gadget — see checking your home for energy leaks.
- Run heavy loads off peak. If your plan has time-of-use pricing, shifting laundry, dishwashing, and EV charging to off-peak hours changes what the same kWh costs — see what time is electricity cheapest.
- Cut the silent baseline. Always-on electronics and idle chargers add kWh nobody sees — see phantom power draw explained.
- Work the full playbook. The lower your bills hub collects the practical fixes, and the electricity explainer hub covers how the numbers on your bill are built.
Sources
- How much electricity does an American home use? — EIA, Frequently Asked Questions. (Retrieved 2026-08-30)
- Use of energy in homes — EIA, Energy Explained. (Retrieved 2026-08-30)
- Units and calculators — EIA, Energy Explained. (Retrieved 2026-08-30)
- Electric Power Monthly, Table 5.6.A — Average Price of Electricity to Ultimate Customers — EIA. (June 2026 data; retrieved 2026-08-30)