Quick Answer
No monitor lowers a bill by itself — it finds the changes that do. EIA’s Short-Term Energy Outlook puts residential electricity near an average 18¢ per kilowatt-hour in 2026, up from roughly 17.3¢ in 2025,[1] and the agency’s monthly update shows average electricity revenue up 4.5% year over year as of June 2026.[2] Every wasted kilowatt-hour costs more than it used to — which is exactly the problem a monitor is built to expose.
Be skeptical of any write-up that promises a payback percentage. What actually happens in most households: week one is fascinating, week two holds a surprise or two, and everything after depends on whether someone acts on what the data says. If nobody will open the app once the novelty fades, or your utility’s free app already answers your questions, the right amount to spend is zero. And if the bill itself is the mystery, the question isn’t a monitor — it’s why your electric bill is so high.
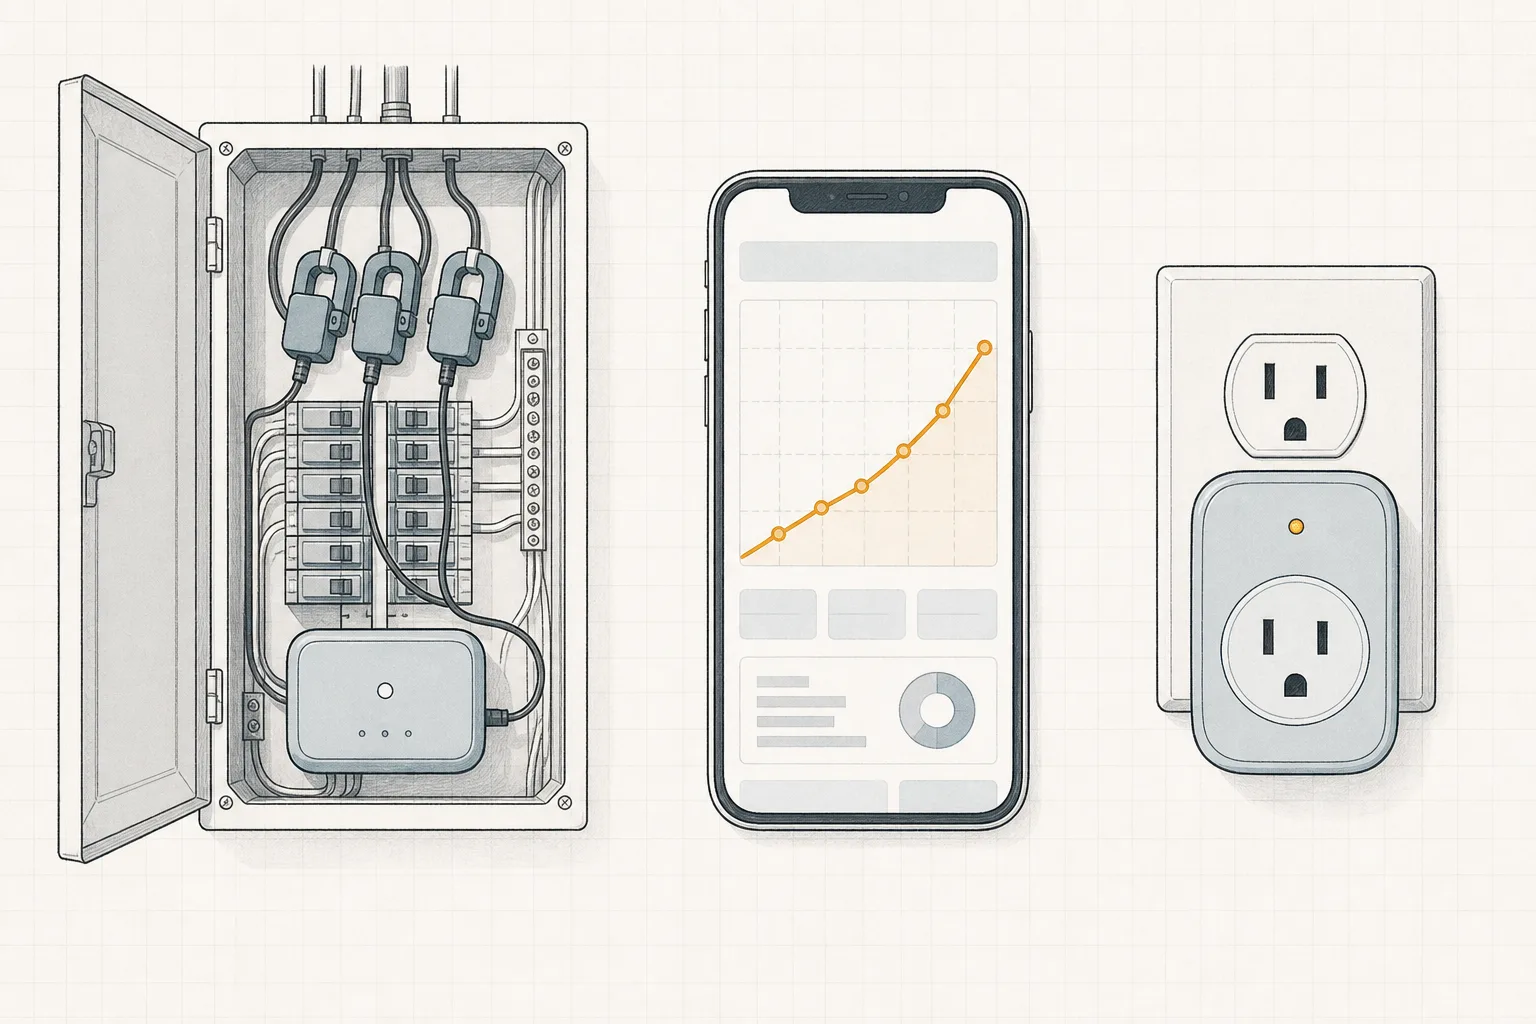
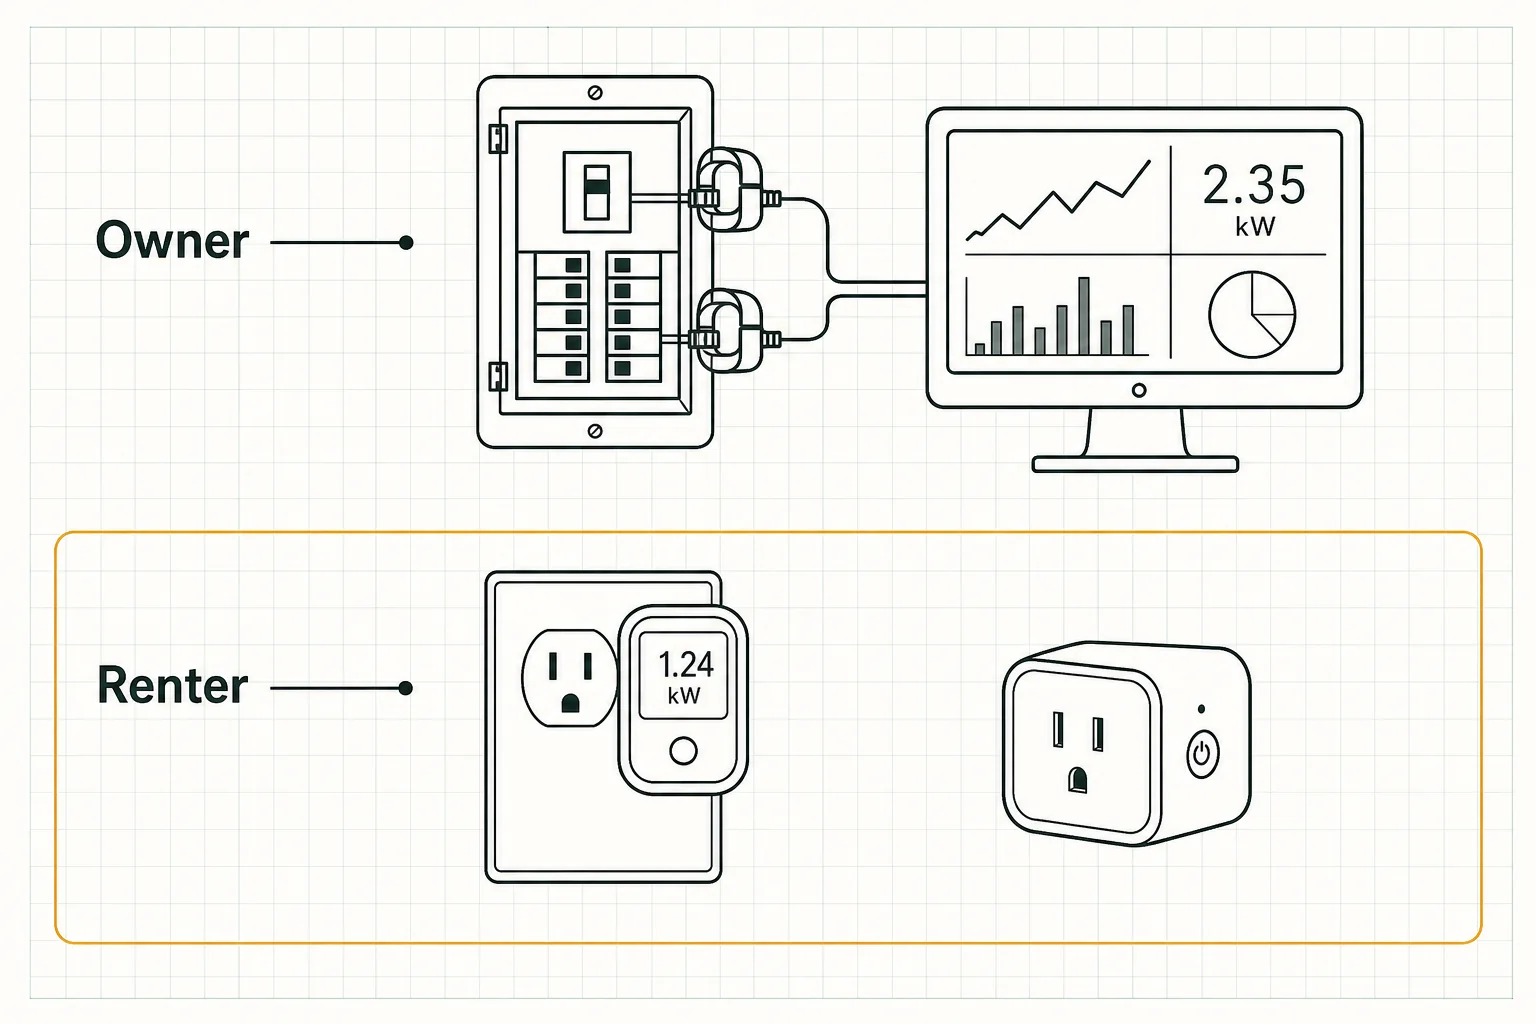
A monitor has never lowered a bill. The changes it shows you do. Three device classes orbit that sentence, and they are not interchangeable. A whole-home monitor clamps current transformers around the conductors in your electrical panel and reads the whole service, circuit by circuit. A plug-in meter sits between one appliance and the wall outlet and reports that appliance alone. And the app most smart-meter homes already have shows whole-house usage for free. This article is about the first class — with honest digressions to the other two, because for many households one of them is the smarter buy.
What a Whole-Home Monitor Can (and Cannot) See
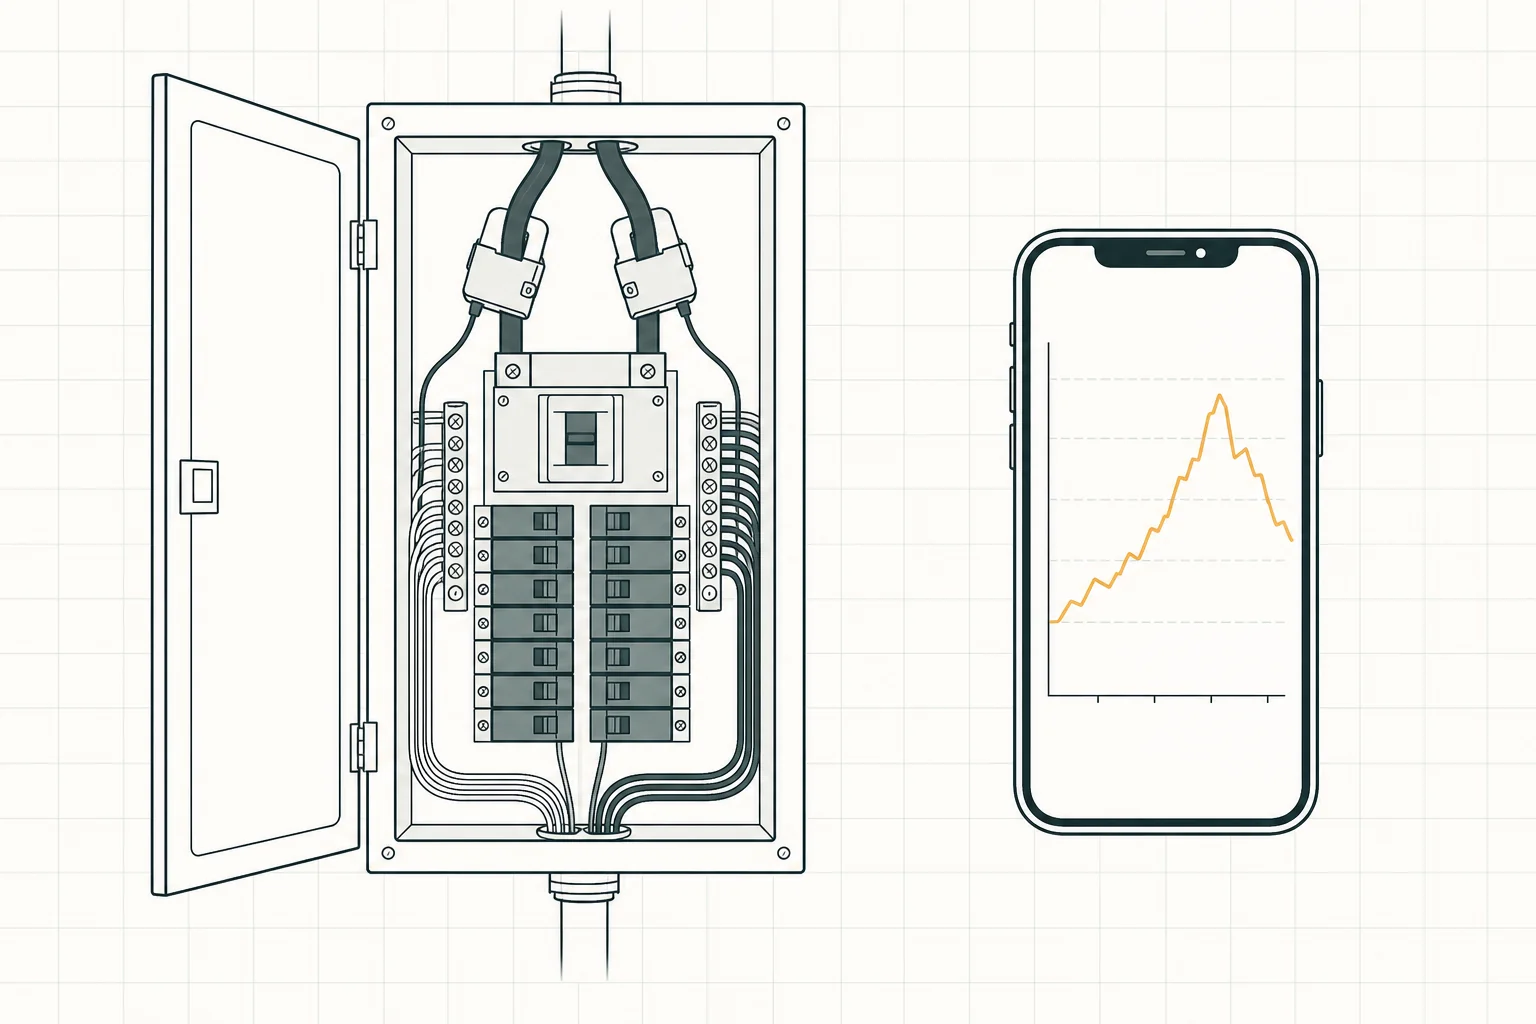
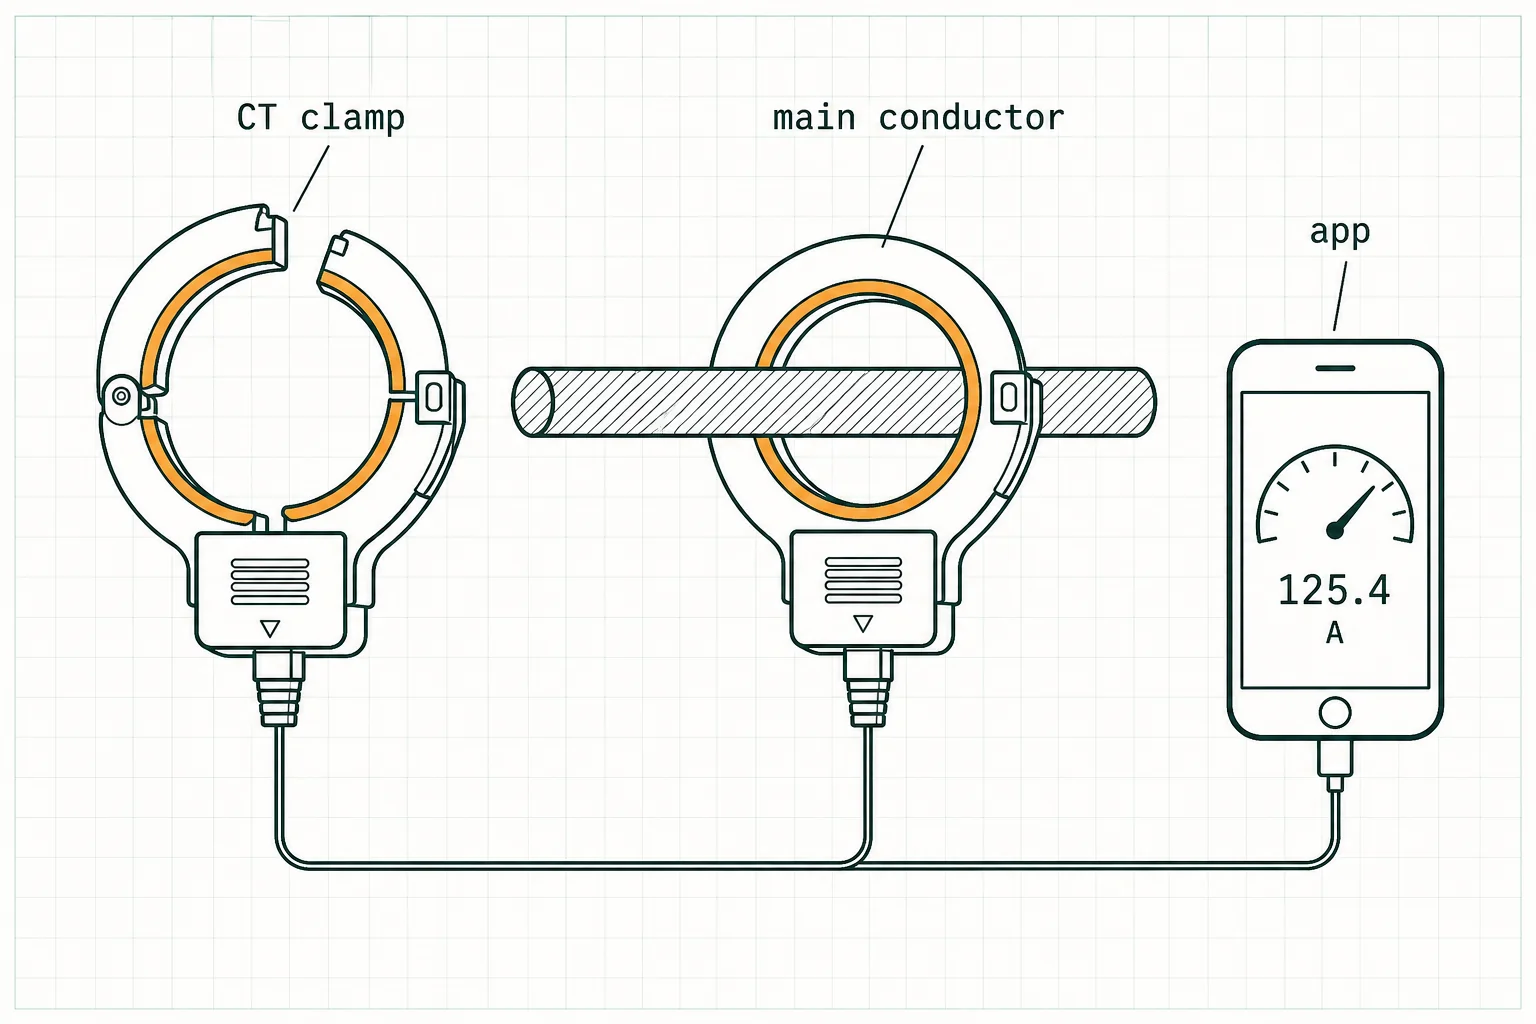
A whole-home monitor reads electricity where it enters the house — everything wired, nothing else. Current transformers (CTs) are clamp-on sensors: snap one around a conductor and it reads the current flowing past without touching bare metal. Two large clamps on the main service legs produce your whole-home number; smaller clamps on individual breakers produce the per-circuit split. The Emporia Vue 3 supports up to 16 circuit sensors (8×50A clamps included), reports real-time usage to its app, and is UL certified.[3]
What it cannot see is the honest half of the spec sheet:
- 240V appliance internals. The monitor reads the circuit, not the appliance. A water heater’s recovery shows up as a long bar on a breaker line; whether the element is scaling or the unit is simply doing its job stays invisible.
- Gas. A gas furnace or tank water heater burns fuel the electric meter never meets. The monitor sees only the blower, ignition, and pump loads.
- Hidden duct losses. Duct leaks in a hot attic arrive as longer air-handler runtime, never as a line item labeled “duct loss.”
On accuracy: manufacturers publish circuit-level accuracy specs, and in practice circuit readings generally reconcile close to the utility meter’s total. But those figures are manufacturer-reported — the party selling the device is grading its own homework. The working rule: use the monitor for comparisons over time and circuit against circuit, and treat the utility meter as the only number your bill obeys.
The Three Bills a Monitor Helps Decode
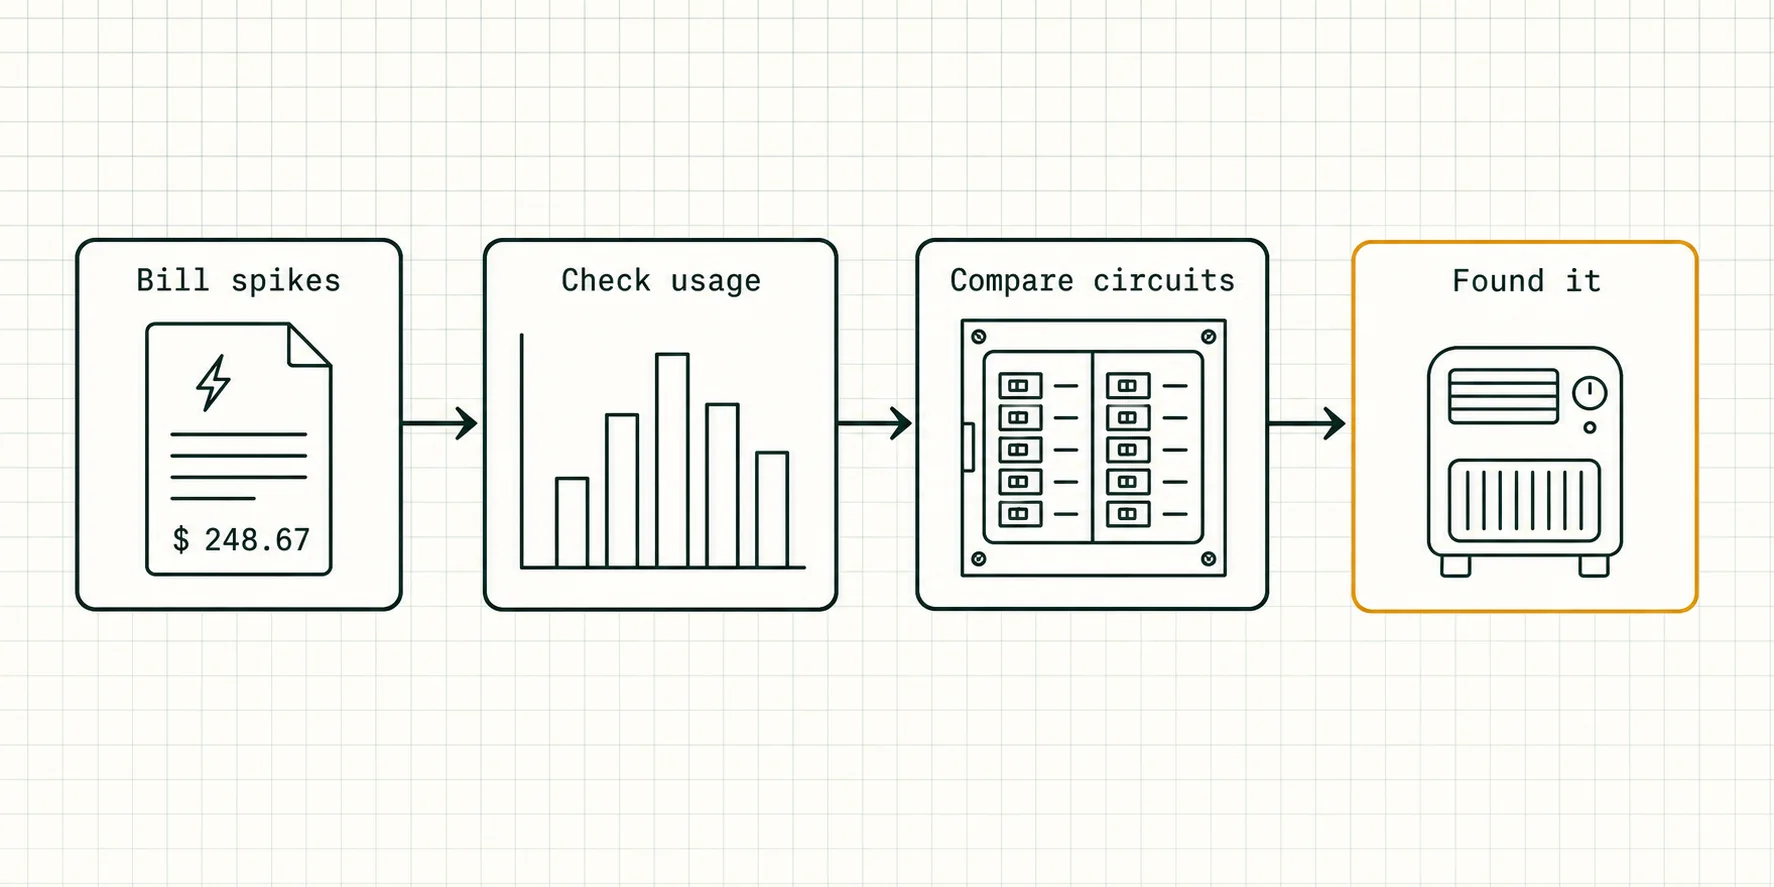
Nearly every “what is going on with this bill” mystery is one of three shapes. A monitor doesn’t fix any of them. It names them.
The spike that doesn’t match your habits. When the bill jumps and nothing changed on your end, the useful question is what changed on the house’s end. A per-circuit monitor answers with names instead of hunches: the guest-room baseboard that ran all week, the well pump cycling overnight. This site’s sudden-spike checklist owns the no-hardware diagnosis; a monitor’s job is catching the next one with a circuit name already attached.
The load that never sleeps. Whole-home monitors routinely surface an overnight floor that never drops to zero — the subject this site covers in full in phantom power explained. The monitor’s contribution isn’t the explanation; it’s your actual overnight baseline on a screen, with circuit names, so the hunt starts somewhere other than the middle.
The Vue 3 hub plus 16 branch CT sensors and mains clamps for real-time, per-circuit use in the app. UL certified and solar-ready. Expect an electrician or experienced-DIY install inside the panel.
Check price on Amazon As an Amazon Associate we earn from qualifying purchases. Price & availability shown on Amazon.com.The appliance on its way out. This is one users look for, and it’s a concept, not a data claim. An aging refrigerator tends to leave a signature: runtime creeping longer, rest periods shrinking, the kitchen circuit’s daily total drifting upward with no change in habits. The monitor doesn’t diagnose compressors — a rising line has innocent explanations too. But set against last spring’s curve, that drift is the evidence you weigh against a repair quote before replacing anything.
Monitor vs. Your Utility’s App (the free competitor)
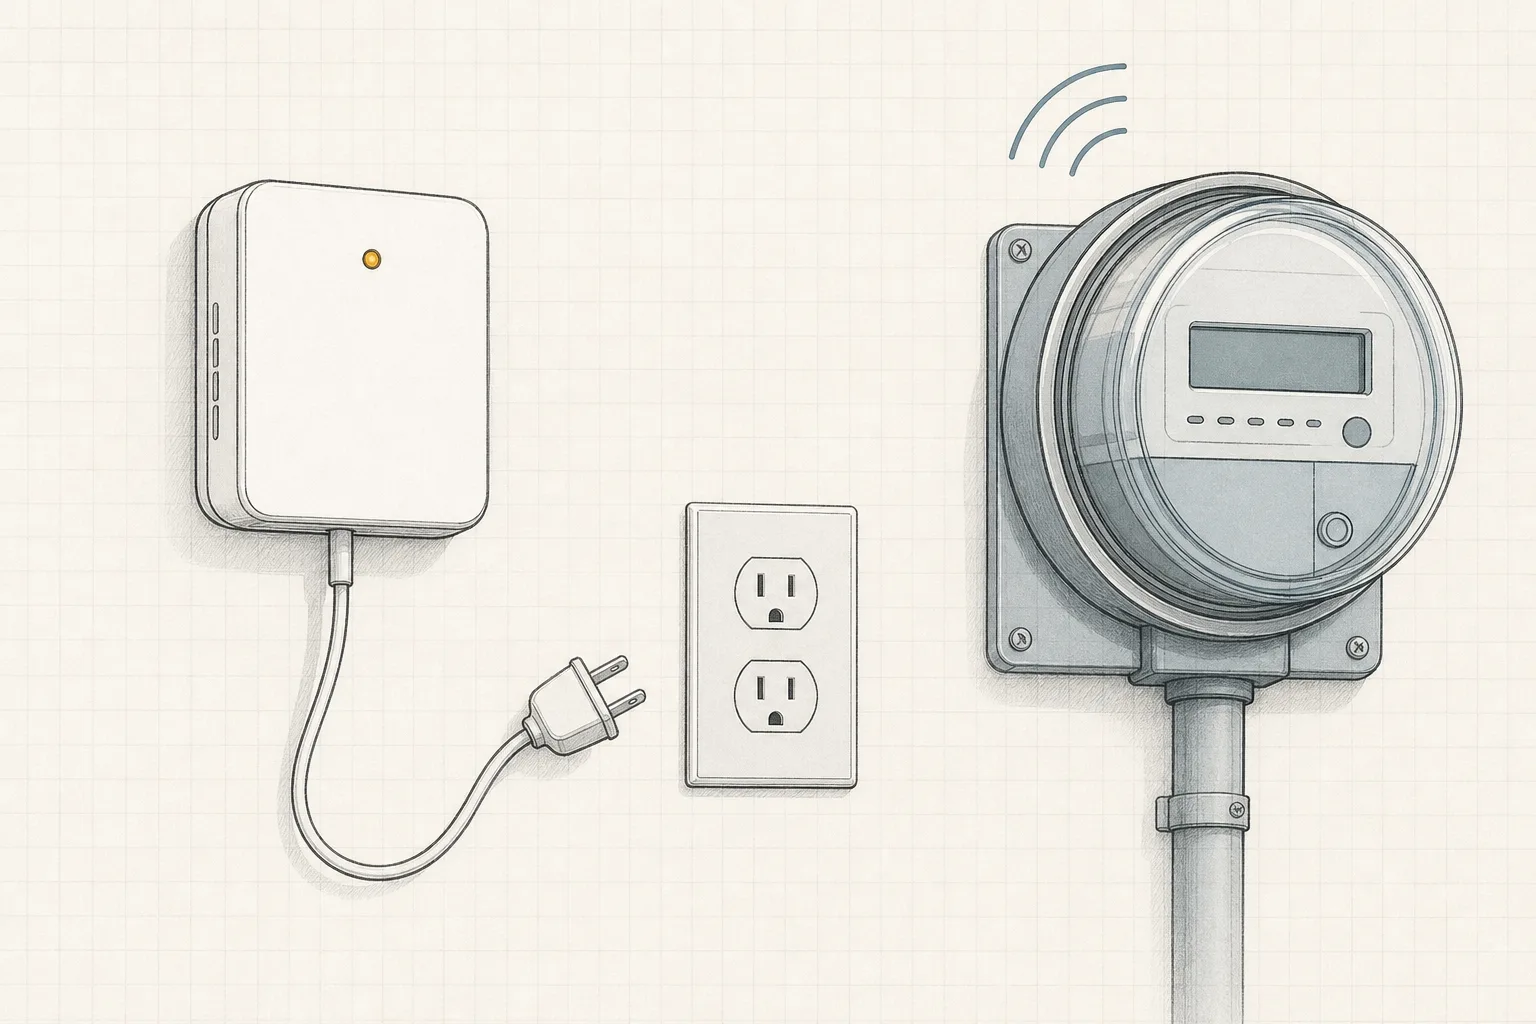
Try the free app before spending a dollar. Most utilities with smart meters now show hourly whole-house usage through a portal or app, drawn from the meter you already pay for. That answers “when did my house use the most” at zero cost.
What the app can’t do is the split: it knows the whole house spiked, not that the spike was the dryer instead of the water heater. It also isn’t real-time. A panel monitor adds both — live watts as appliances switch on, and per-circuit totals assigned to breakers. The Emporia-versus-Sense fork lives here too: clamped circuits name their loads explicitly, while Sense’s machine learning infers devices from whole-home signatures, and Sense is sold direct rather than through Amazon.[4]
When the free app is enough: if your questions are calendar-shaped — was this month the heat wave or the guests — hourly aggregate data settles them. If you can already name your biggest loads from memory, buy nothing until an app answer genuinely dead-ends. The monitor’s value begins where the aggregate graph stops, and many households never get there. (The same see-it-then-act logic runs the water side of the house — point sensors vs. a whole-home shutoff is that ladder.)
The Behavior Bridge
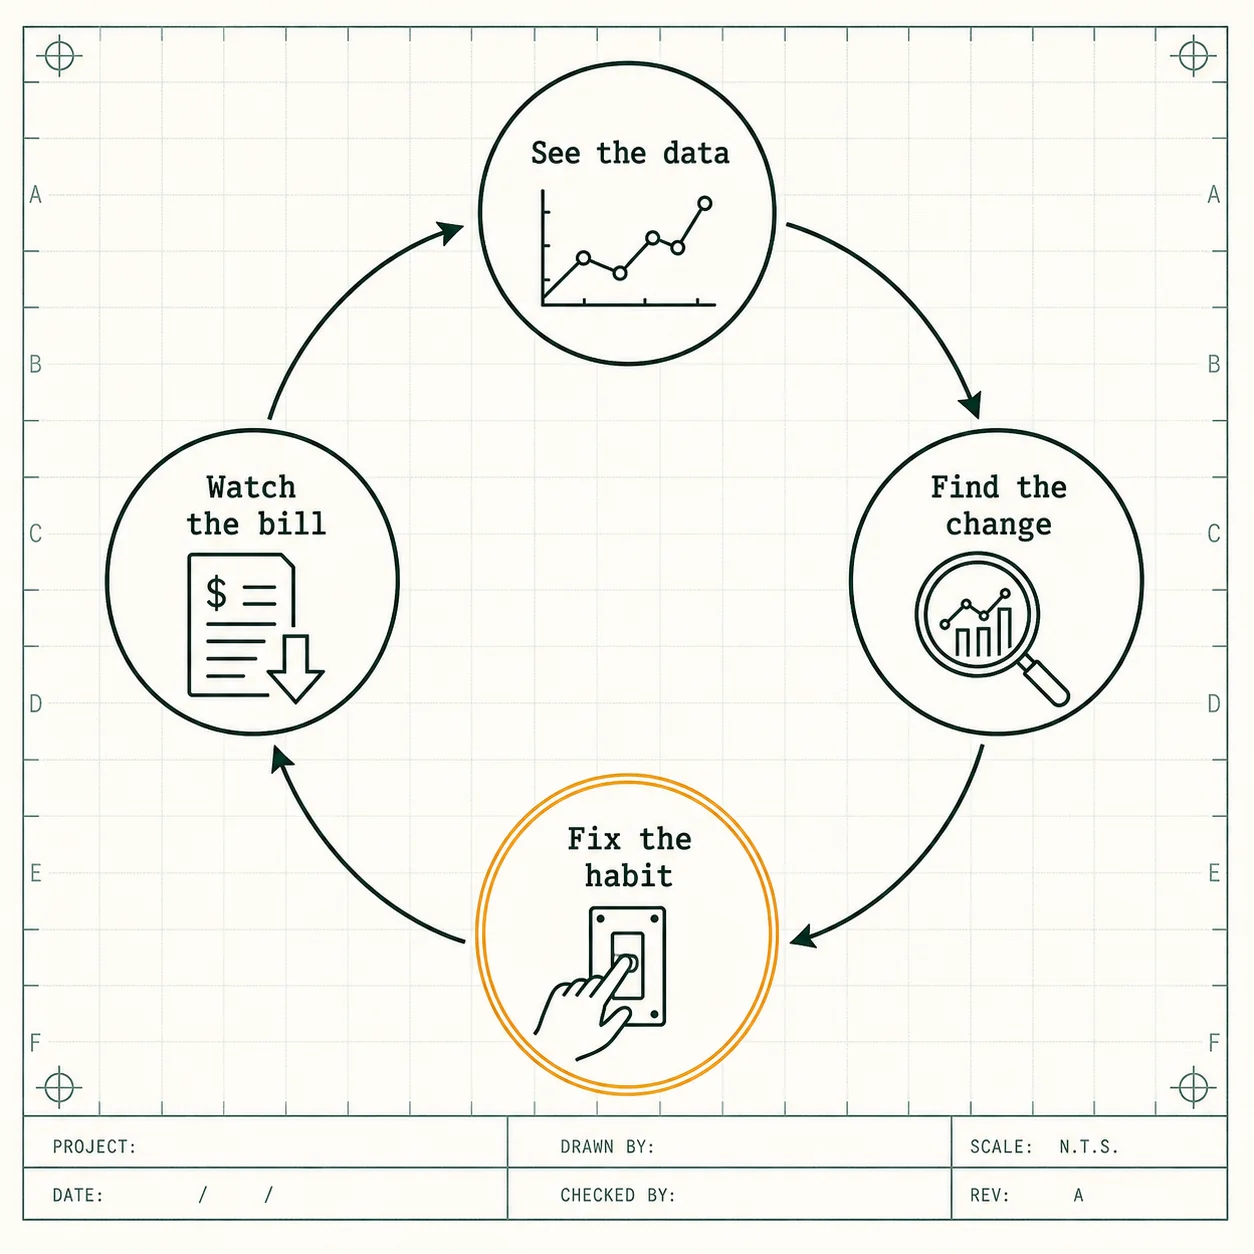
A monitor saves money in exactly one place: the moment the data changes a decision. The screen isn’t the product; the four moves below are. Each runs the same shape — what the data shows, then what you change. Mechanism only: your rates, your appliances, and your habits set the numbers.
- Shift the schedule the rate plan punishes. The data shows the dryer and the dishwasher landing in the peak window every day, by nobody’s choice. What you change: delayed-start cycles moved to off-peak hours — the arithmetic is in how time-of-use electricity works, and it only favors you if your plan actually prices peak windows.
- Time the replacement you were postponing. The data shows the old refrigerator’s circuit drawing visibly more than it did a year ago. What you change: the calendar on a decision you were already circling — measured runtime against a new unit’s spec sheet, weighed alongside the rebates cataloged at DOE’s Energy Savings Hub.[5]
- Kill the circuits that run for nobody. The data shows an overnight floor that never reaches zero, and per-circuit history shows which breakers hold it up. What you change: switchable power strips and a lights-out habit for loads that genuinely belong off at night. The fence stays fixed: medical equipment, sump pumps, security cameras, and refrigeration are never on the kill list.
- Catch the long runtimes you never see. The data shows high-duty loads operating outside their intended schedules — a pool pump running past its timer setting, a dehumidifier cycling around the clock in a damp basement. What you change: the timer, the humidistat setpoint, or the drain routing — corrections you would never have guessed at without the log.
Comparing the Monitors
Every panel monitor below does the same core job; what differs is granularity, install burden, and where each one hides its catch. Price bands are manufacturer list and Amazon-tracked ranges as of late August 2026.[6]
| Monitor | Price band | Circuits | Install | Renter-ok | The catch |
|---|---|---|---|---|---|
| Emporia Vue 3 | $199.99 list; ~$142–164 on Amazon | Up to 16 circuit sensors + mains | Panel | No | Needs physical space for clamps in the panel |
| Refoss EM16P | ~$100–150 | 16-circuit class | Panel | No | Smaller public track record than the category leaders |
| Eyedro | ~$100–200 | Model-dependent | Panel | No | Cloud plans — confirm what is included free versus billed before buying |
| Sense | Direct from sense.com | Whole-home, machine-learning device detection | Panel | No | Sold direct (sense.com), not confirmed on Amazon — no link here |
Where to find them: the Refoss EM16P and Eyedro were confirmed on Amazon’s search pages for this article’s research, but that pass produced no individually verified ASINs — search brand and model name rather than trusting an identifier from any article, this one included.[7] The Emporia Vue 3 links on this site point at the sensor-kit variants (ASIN B0C79PNK84 and siblings), not the monitor-only base unit. Sense is the caveat row by design: buying it means leaving the Amazon marketplace entirely.
The install is the safety story: CT clamps attach around conductors inside an electrical panel. If you have never worked in a panel with the main off and still treated every conductor as energized, put an electrician on the install — the labor is cheap against the mistake. If panel-level data fits your situation, the Vue 3 is where most households start.
Plug-in meter for any 120V outlet load up to 1875 W — live watts and cumulative kWh for the one appliance you suspect most. No app, no panel, no electrician.
Check price on Amazon As an Amazon Associate we earn from qualifying purchases. Price & availability shown on Amazon.com.The Vue 3 hub plus 16 branch CT sensors and mains clamps for real-time, per-circuit use in the app. UL certified and solar-ready. Expect an electrician or experienced-DIY install inside the panel.
Add to cart on Amazon Price & availability shown on Amazon.com — we may earn a commission.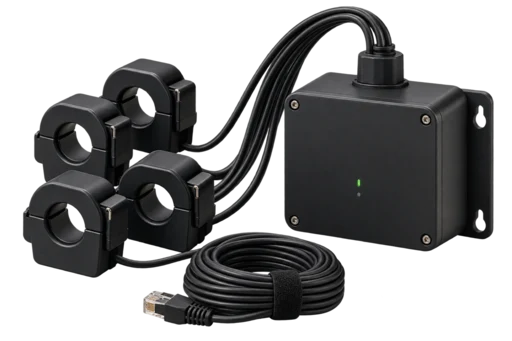
The Renter’s Path
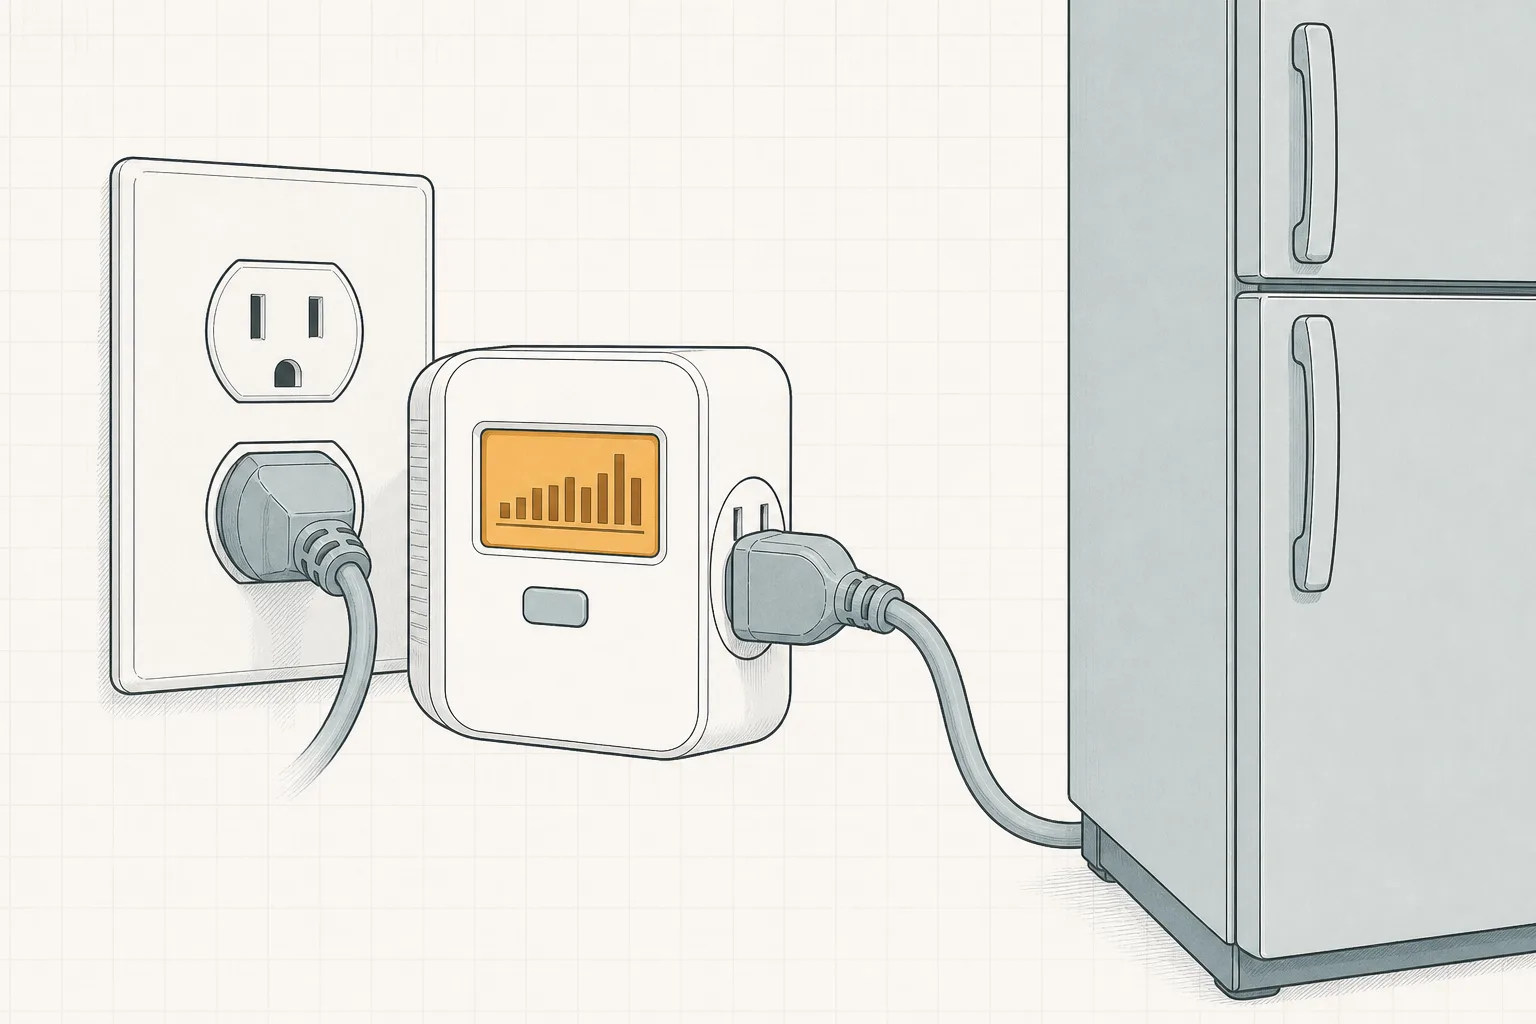
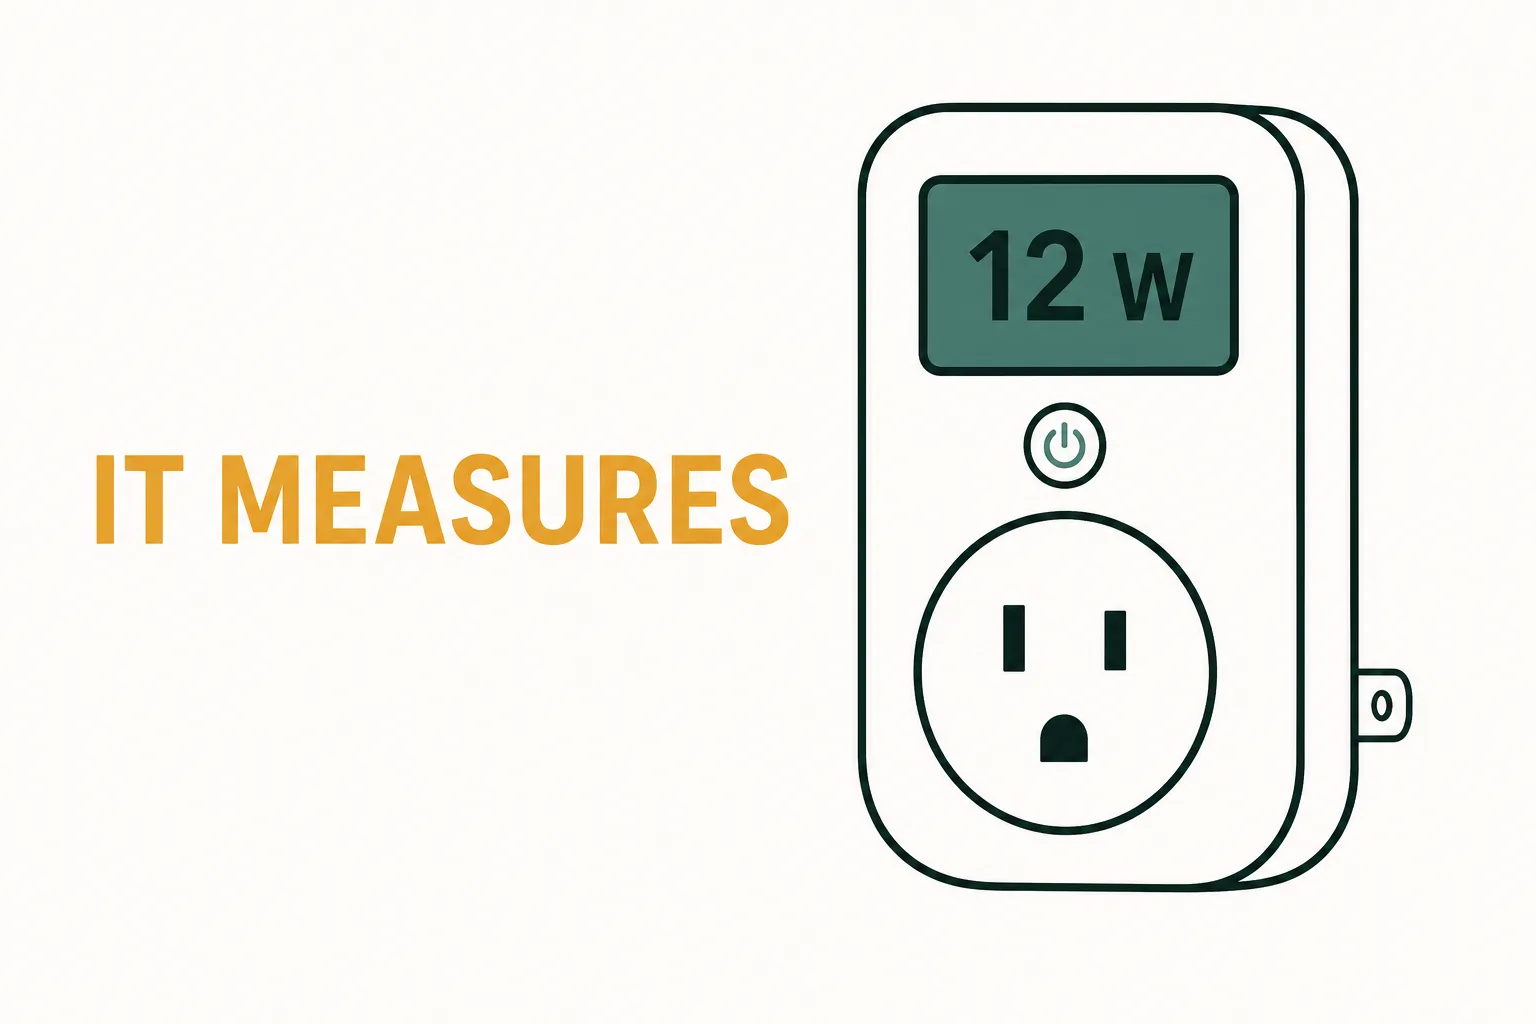
Renters get the measurement discipline without the panel — one appliance at a time. A plug-in meter like the P3 Kill A Watt P4400 sits between an appliance and a standard 120V outlet, reporting live watts and cumulative kilowatt-hours for loads up to 1875 W — headroom enough for a refrigerator, an entertainment cluster, or whichever device you suspect most. It cannot see hardwired or 240V loads. It answers the plug-sized half of the bill using the same DOE-documented measurement approach behind this site’s standby-power testing.[8]
For ongoing visibility rather than one-off checks, energy-monitoring smart plugs carry the job into the app era — this site’s smart-plug guide covers which plugs meter energy and how to use them safely. When you want the simplest instrument of all, nothing to pair and nothing to configure, the classic plug-in meter is still the standard.
Plug-in meter for any 120V outlet load up to 1875 W — live watts and cumulative kWh for the one appliance you suspect most. No app, no panel, no electrician.
Check price on Amazon Price & availability shown on Amazon.com — we may earn a commission.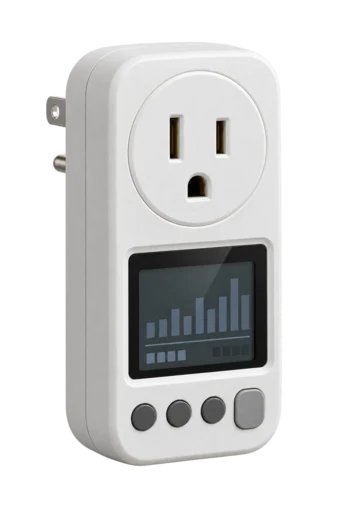
When a Monitor Is a Waste of Money
Some houses are already answered, and hardware cannot un-ask the question. Fit the tool to the household; several should skip it entirely:
- The already-diagnosed house. If you have had an energy audit, know your big loads, and are mid-plan, a monitor mostly re-tells you your own file.
- The satisfied app user. If the utility’s hourly data has answered everything you have thrown at it, the per-circuit split may never earn its cost.
- The not-going-to-act household. A monitor nobody opens is a graph of your own habits wearing a price tag — the data says measurement without response moves nothing.
- The one-appliance question. If the whole mystery is what the spare freezer costs, a plain plug-in meter answers it with no panel work and no electrician.
If the goal is simply a lower bill rather than better data, how to lower utility bills is the broader toolbox.
Frequently Asked Questions
How accurate are home energy monitors?
Do I need an electrician to install one?
Can a monitor work with solar panels?
The 2026 landscape shifted: Sense stopped selling its monitor — what Sense owners and buyers should do is covered separately, and the current buyable ladder is in the best home energy monitor 2026.
Sources
- EIA Short-Term Energy Outlook — Electricity — residential average ~18¢/kWh in 2026, up from ~17.3¢ in 2025. Retrieved August 30, 2026.
- EIA Electricity Monthly Update — End-Use Consumption — all-sector average revenue 14.48¢/kWh in June 2026, +4.5% year over year. Retrieved August 30, 2026.
- Emporia Vue 3 product page — Emporia Energy — $199.99 list; up to 16 circuit sensors (8×50A clamps included); UL certified; real-time usage; solar/net metering. Retrieved August 30, 2026.
- Sense Energy Monitor — sense.com — machine-learning device detection; sold direct, not confirmed on Amazon. Retrieved August 30, 2026.
- U.S. Department of Energy — Energy Savings Hub — rebates, incentives, and why bills rise. Retrieved August 30, 2026.
- Emporia Vue 3 — Amazon listing — Amazon-tracked price band ~$142–164. Retrieved August 30, 2026.
- Refoss EM16P and Eyedro price bands (~$100–150 and ~$100–200) confirmed on Amazon search pages at retrieval. Retrieved August 30, 2026.
- U.S. Department of Energy FEMP — Measuring Standby Power — measurement method behind this site’s standby-power figures. Retrieved August 30, 2026.
- P3 Kill A Watt P4400 — Amazon listing — 1875 W maximum load for 120V plug-in metering. Retrieved August 30, 2026.