Quick Answer: Average U.S. Utility Bills in 2026
Here is the national breakdown for the narrow basket:
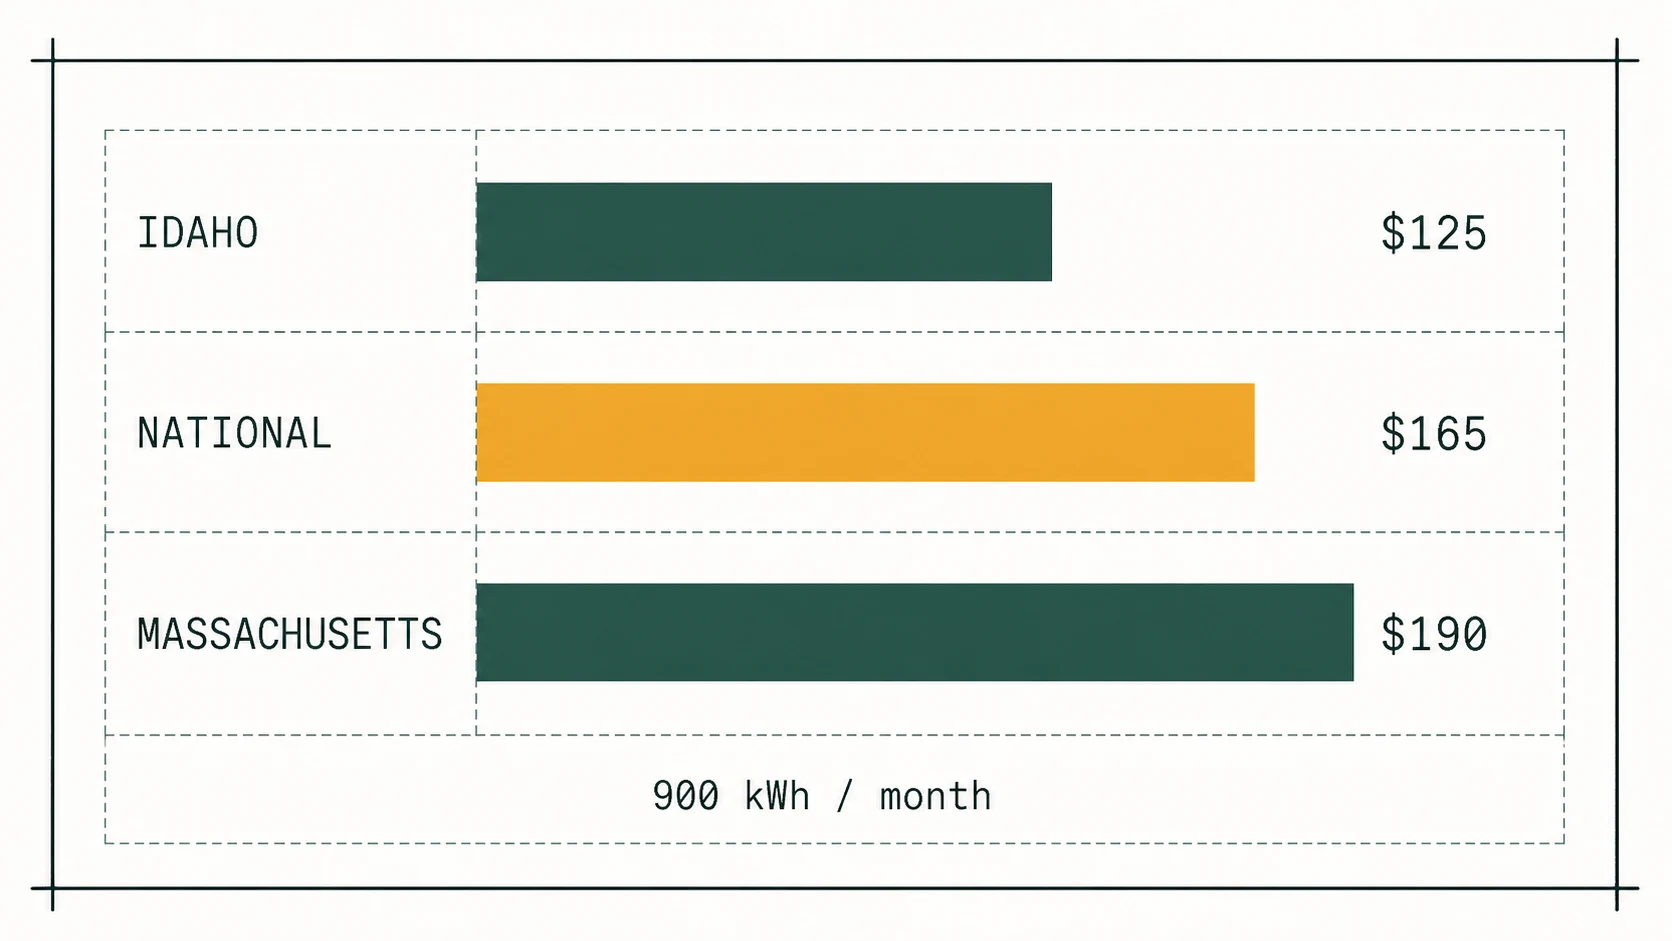
- Electricity: $165/month (900 kWh at 18.34¢/kWh — EIA national residential average, June 2026)
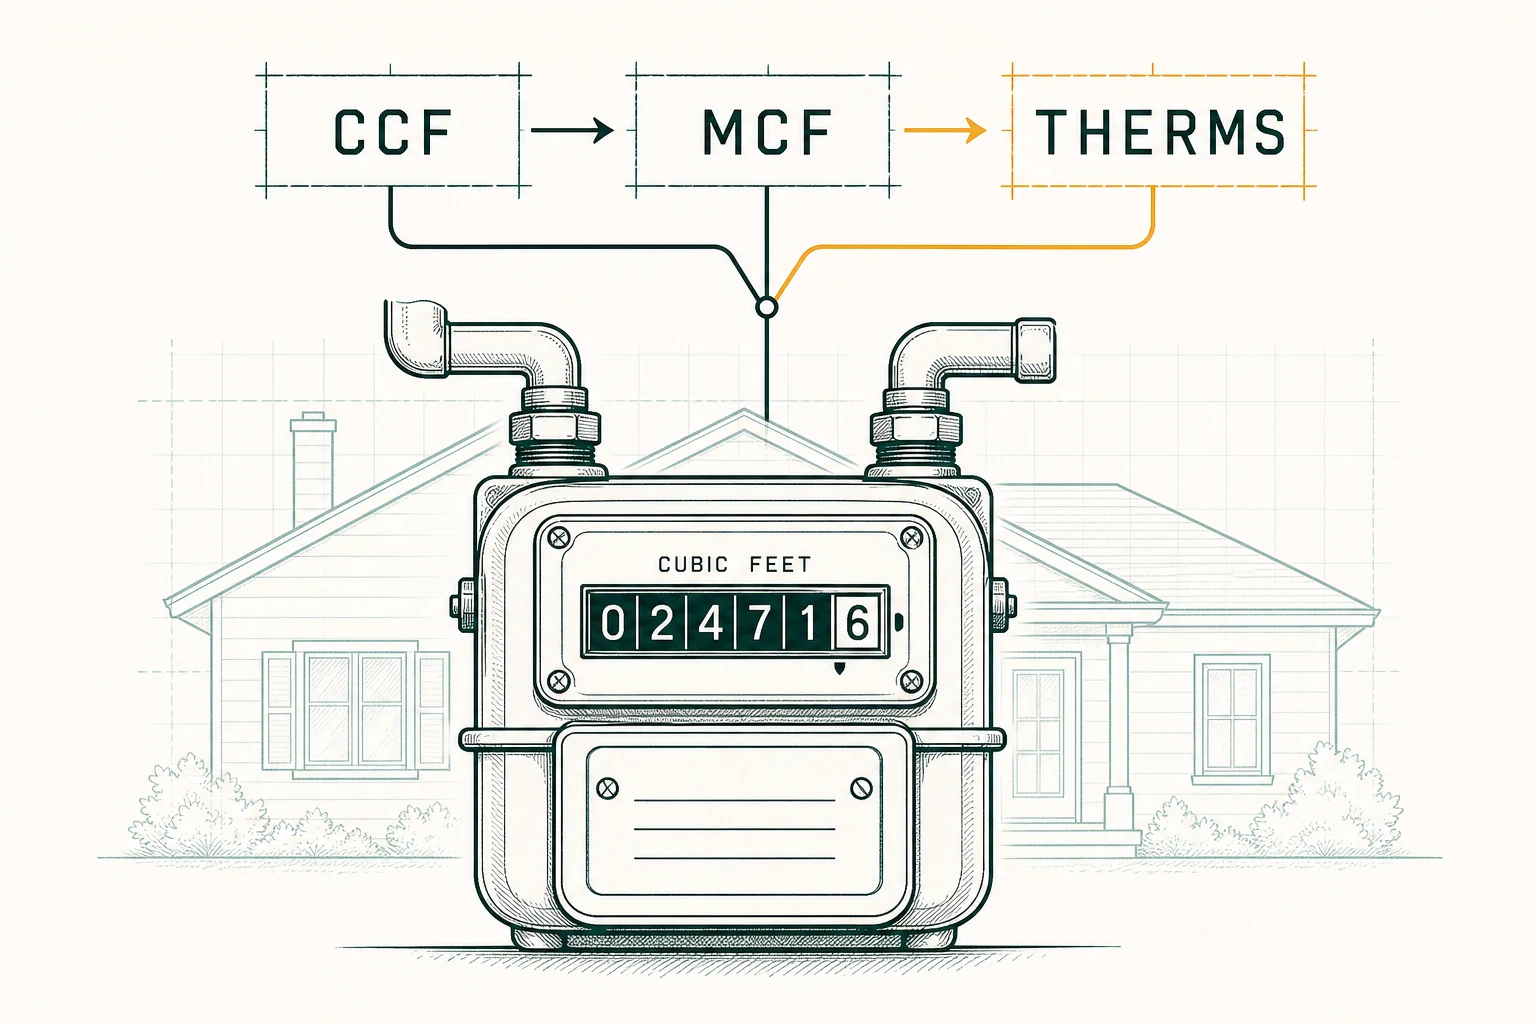
- Natural gas: $80–$170/month for a gas-heated home at 75 therms (EIA state residential prices run ~$1.04–$2.29/therm; ~$1.91/therm national average, May 2026) — winter high, summer low
- Water & sewer: roughly $70–$90/month combined ($47 water plus $25–$40 sewer, per the water section below)
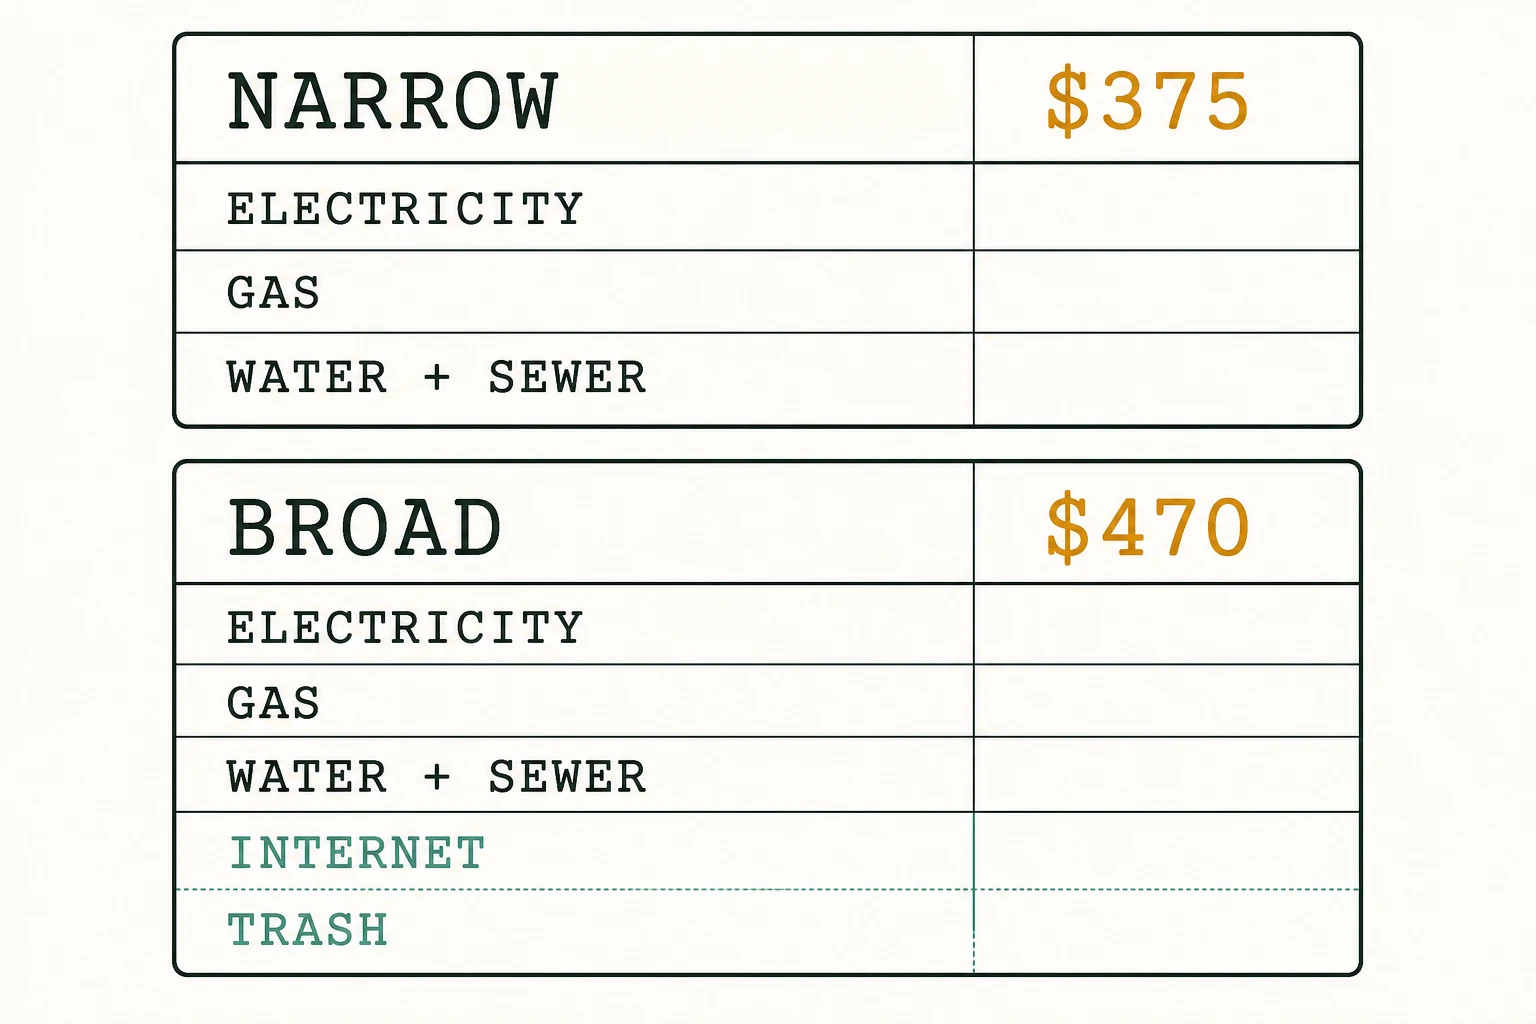
How we calculate: This guide uses two definitions to avoid confusion. The narrow basket (electricity + gas + water) is the standard used in the state-by-state table below and matches EIA reporting conventions. The broad basket adds internet, trash, and sewer charges that are often included in the term "utilities" but are not tracked by energy data agencies. At national-average rates and standard usage, the narrow basket runs about $375/month (roughly $315–$425 across states); the broad basket — adding internet, trash, and the sewer charges energy agencies do not track — is roughly $470/month ($390–$540).
Broad basket adds:
- Internet: $60–$80/month
- Trash/recycling: $15–$35/month (often bundled with water)
The cheapest states for utilities are Idaho, Utah, and Washington (abundant hydropower). The most expensive are Hawaii, Alaska, and Connecticut. The tables below cover 17 states sampled across every region and price tier, plus national averages that apply anywhere.
Understanding the Average Utility Bills by State in 2026
Utility costs vary widely across the U.S. in 2026—not just due to regional differences in energy sources, but also because of state regulations, climate, and infrastructure age. Whether you're moving, budgeting for a new home, or just curious how your bill compares, knowing the average utility bills by state 2026 gives you real leverage in financial planning.
In this article, we break down electricity, natural gas, and water/sewer costs for a 17-state sample chosen to span every region and price tier — and give the national math you can apply to any state. We use the most recent data from the U.S. Energy Information Administration (EIA), the American Water Works Association (AWWA), and state public utility commissions—all adjusted for inflation and projected trends through 2026.
All figures below reflect typical monthly usage for an average household: ~900 kWh of electricity, ~75 therms of natural gas, and ~7,500 gallons of water. Read the table as a standardized estimate, not a survey median: each electric cell is the state’s average residential rate multiplied by 900 kWh, so states match on usage and differ only on price — your own bill depends on your usage, rate plan, and season. Verify your current rate on your utility’s tariff page. We’ll also highlight where costs are rising fastest—and where they’re surprisingly affordable.
Electricity Rates by State: 2026 Breakdown
Electricity remains the most visible part of your utility bill—and the most variable. In mid-2026, the national average residential electricity rate is 18.34¢/kWh (EIA Electricity Monthly Update, June 2026), up from 17.30¢ in FY2025 due to rising fuel costs and grid modernization investments. But this average hides dramatic regional splits.
States with abundant renewable or fossil fuel resources—like Idaho (hydro), Louisiana (natural gas), and Washington (hydro + nuclear)—tend to have the lowest electricity rates. Meanwhile, states reliant on imported fuels, older infrastructure, or high environmental fees—like Hawaii, California, and Alaska—face the highest prices.
Here’s a snapshot of the 10 states with the lowest 2026 electricity rates (per kWh):
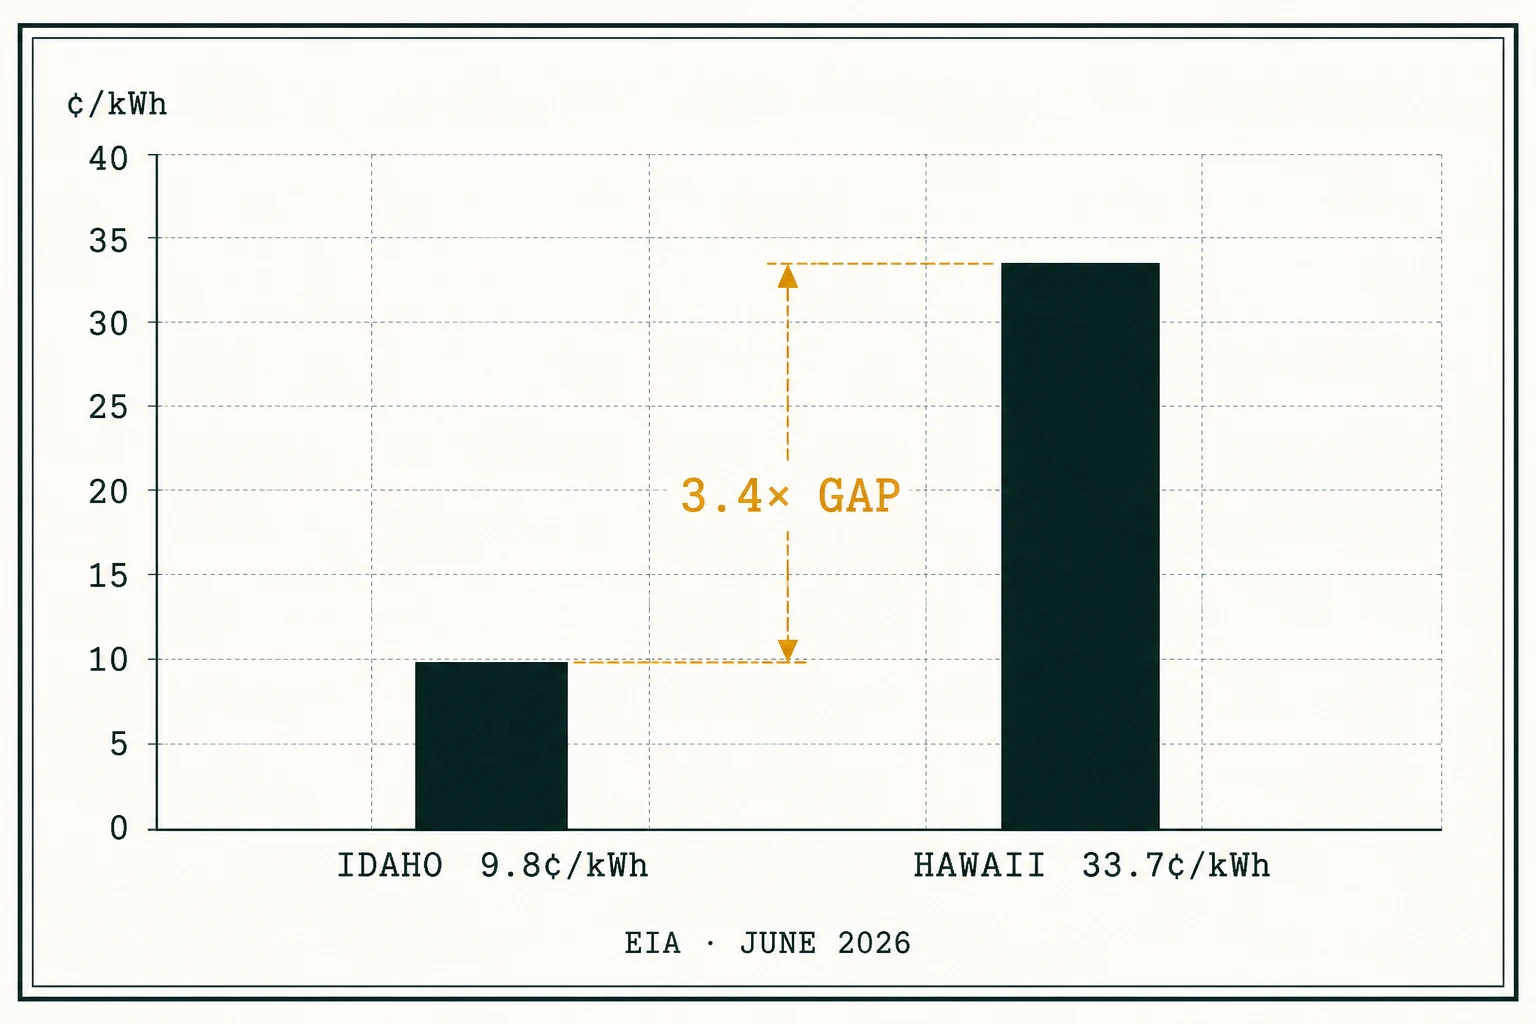
- Idaho: 9.8¢
- Washington: 10.1¢
- Utah: 10.4¢
- North Dakota: 10.7¢
- Montana: 10.9¢
- Nebraska: 11.0¢
- Oklahoma: 11.2¢
- Kansas: 11.3¢
- Arkansas: 11.4¢
- Missouri: 11.5¢
By contrast, the 10 states with the highest 2026 electricity rates include:
- Hawaii: 33.7¢
- California: 28.4¢
- Alaska: 26.2¢
- Massachusetts: 24.9¢
- Rhode Island: 24.5¢
- New York: 23.8¢
- Connecticut: 23.5¢
- Vermont: 22.9¢
- New Jersey: 22.3¢
- Maryland: 21.7¢
Those high rates in the Northeast and Hawaii reflect a mix of high fuel imports, strict environmental standards, and aging transmission systems. In fact, Hawaii continues to pay nearly 3.4× more per kWh than Idaho—not just because of geography, but also because of state policies pushing toward 100% renewable energy by 2045, which have raised short-term costs.
      <p>Importantly, electricity isn’t just about the rate—your <em>bill</em> depends on usage. Cold winters in the Upper Midwest mean more heating (and higher gas use), while hot summers in the South drive up AC demand. So while Alaska’s rate is high, the average monthly electric bill there is only $142—still above the national average of $165—because usage is lower than in sunbelt states.</p>
      <h3>How 2026 Electricity Rates Compare to 2025</h3>
      <p>Compared to 2025, most states saw electricity rates increase by 2–6%, driven primarily by natural gas price spikes and grid reliability upgrades following the 2025 winter storms. The biggest jumps occurred in:</p>
      <ul>
      <li><strong>Pennsylvania</strong>: +7.1% (due to capacity market reforms)</li>
      <li><strong>Texas</strong>: +5.8% (ERCOT infrastructure upgrades)</li>
      <li><strong>Florida</strong>: +6.3% (coal-to-gas conversions)</li>
      </ul>
      <p>Meanwhile, Idaho and North Dakota saw slight decreases (−0.9% and −1.2%, respectively), thanks to new transmission lines and stable hydropower output.</p>
      <p>For more context on how your state’s utility commission sets rates, see our guide on <a href="/blog/10-fixed-vs-variable-utility-rate/">how utility rates are set</a>.</p>
Gas Bills by State: Heating Drives the Difference
Natural gas prices fluctuated less than electricity in 2026, but regional differences remain stark. The national average natural gas rate is $1.12 per therm, down slightly from $1.18 in 2025 due to increased domestic production and milder winter forecasts.
States with extensive pipeline infrastructure and local production—like Louisiana, Texas, and Oklahoma—enjoy the lowest gas rates. In contrast, states relying on imported gas through constrained corridors—like New England and the Northeast—pay significantly more.
The lowest average gas rate in 2026 is in Louisiana: $0.75/therm. The highest is in Massachusetts: $1.89/therm.
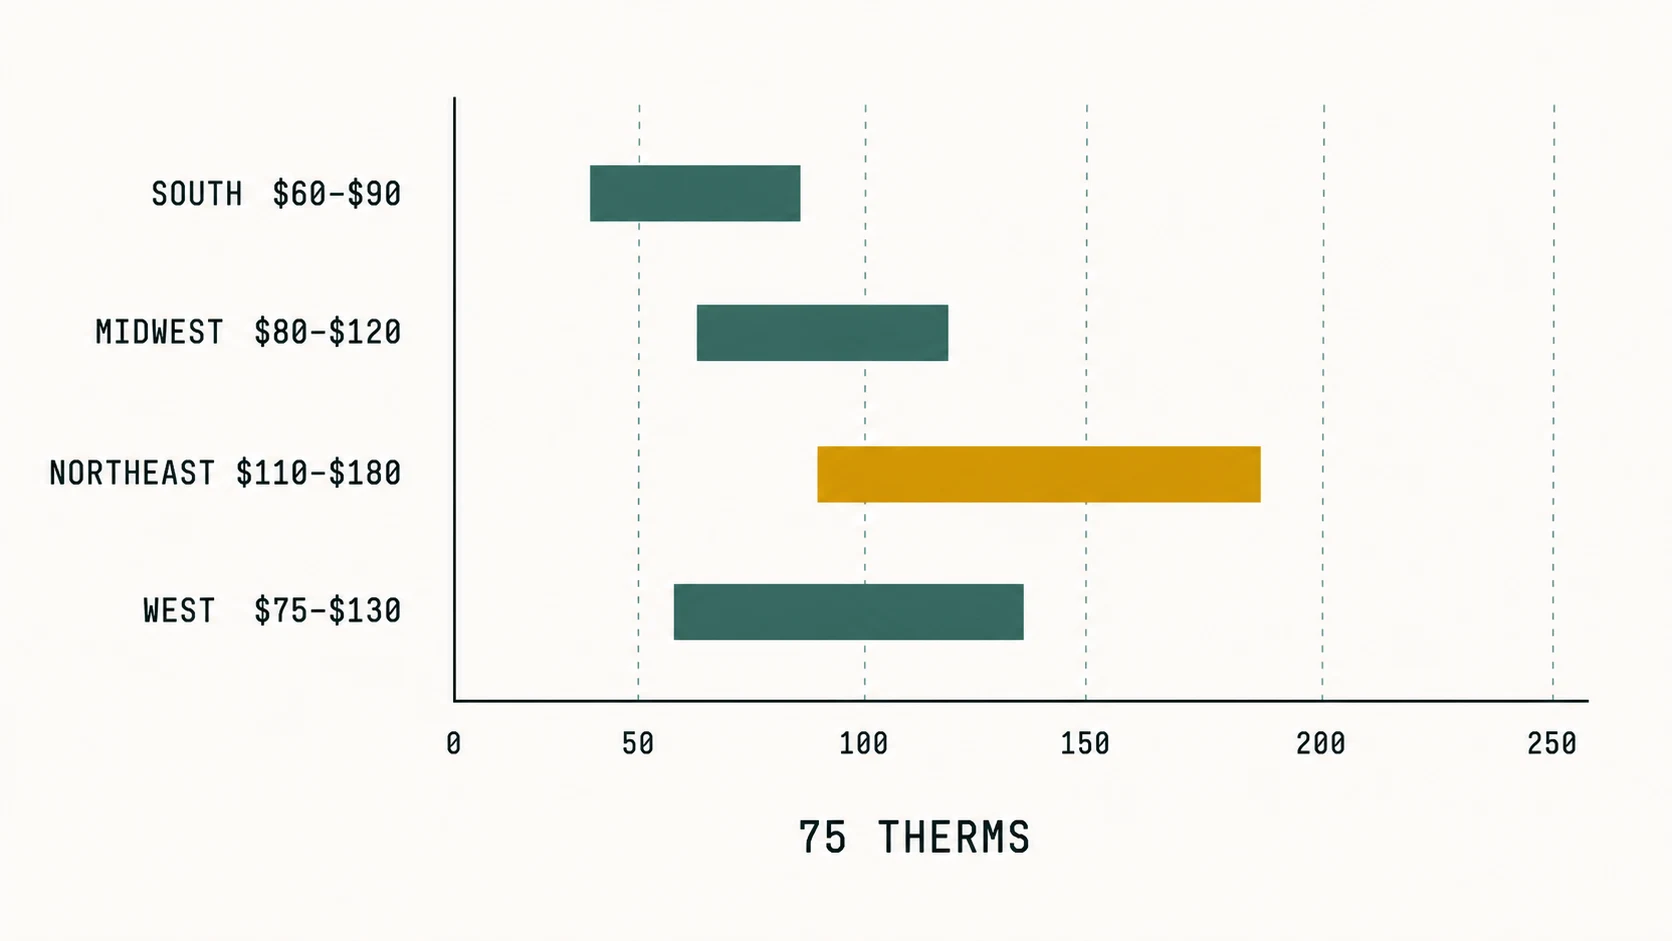
Here’s how monthly gas bills break down across regions (based on ~75 therms used):
- South (e.g., Texas, Alabama, Georgia): $60–$90/month
- Midwest (e.g., Illinois, Ohio, Michigan): $80–$120/month
- Northeast (e.g., New York, Massachusetts, Maine): $110–$180/month
- West (e.g., California, Oregon, Colorado): $75–$130/month
      <p>California stands out: despite moderate gas prices ($1.42/therm), high home insulation standards and smaller homes keep gas bills lower than the Northeast. Meanwhile, Maine’s average gas bill is $168/month—despite a rate of $1.76/therm—because homes are older, less efficient, and winters are harsher.</p>
      <p>Also note: many households use both gas and electricity for heating. In 2026, <strong>hybrid heating systems</strong> (e.g., heat pumps paired with gas backup) are growing rapidly in cold states like Minnesota and Vermont, leading to more balanced electric/gas usage—and sometimes <em>lower</em> total utility bills.</p>
Water and Sewer Bills: The Overlooked Utility
Water and sewer bills often surprise people—they’re usually the smallest utility line item, but they’re rising faster than electricity or gas in many areas due to aging infrastructure and drought-related conservation fees.
The national average water bill in 2026 is $47/month, up from $44 in 2025. Sewer charges typically add another $25–$40, depending on local treatment costs and system age.
States with the lowest combined water & sewer bills in 2026:
- Arkansas: $38/month
- Kansas: $40/month
- Missouri: $41/month
- Tennessee: $42/month
- North Dakota: $43/month
States with the highest combined water & sewer bills:
- Hawaii: $88/month
- California: $79/month (including drought surcharges in many areas)
- Massachusetts: $76/month
- New Jersey: $74/month
- Connecticut: $71/month
California’s high costs aren’t just from rates—many cities (like San Diego and Los Angeles) add drought surcharges during dry periods. Some states have implemented conservation-tier pricing, meaning you pay more per gallon as your usage increases.
Water bills also vary dramatically within states. In Texas, for example, Austin averages $52/month, while El Paso (with extensive reuse and desalination) is $39—despite being in a drought-prone region. That’s thanks to long-term infrastructure planning.
For practical ways to reduce your water bill, check out our water-saving tips for homeowners.
Total Utility Cost Comparison: 2026 State-by-State Summary
Putting it all together, here’s how the average total monthly utility bill (electricity + natural gas + water + sewer) breaks down by region in 2026:
      <ul>
      <li><strong>Lowest cost region</strong> (South Central): $170–$200/month</li>
      <li><strong>Moderate cost region</strong> (Midwest, Southwest, Rocky Mountains): $190–$230/month</li>
      <li><strong>Higher cost region</strong> (Northeast, Pacific Northwest, California): $240–$300/month</li>
      <li><strong>Highest cost state</strong>: Hawaii (~$324/month using state-specific usage; table uses standardized 900 kWh)</li>
Below is a full comparison table of average utility bills for 2026. All figures are monthly averages for typical household usage.
| State | Electricity ($/mo) | Gas ($/mo) | Water & Sewer ($/mo) | Total ($/mo) |
|---|---|---|---|---|
| Alaska | $142 | $88 | $56 | $286 |
| Arizona | $160 | $45 | $42 | $247 |
| Arkansas | $138 | $60 | $38 | $236 |
| California | $185 | $79 | $79 | $343 |
| Florida | $175 | $55 | $44 | $274 |
| Georgia | $155 | $65 | $41 | $261 |
| Hawaii | $303* | $62 | $88 | $453* |
| Idaho | $125 | $70 | $30 | $225 |
| Illinois | $145 | $110 | $45 | $300 |
| Massachusetts | $190 | $168 | $76 | $434 |
| Michigan | $148 | $125 | $42 | $315 |
| Mississippi | $132 | $60 | $36 | $228 |
| Montana | $135 | $95 | $32 | $262 |
| New Jersey | $195 | $130 | $74 | $400 |
| New York | $192 | $145 | $71 | $408 |
| Texas | $158 | $80 | $40 | $278 |
| Wyoming | $118 | $85 | $34 | $237 |
Note: Data sources include EIA, AWWA, and state PUC reports (2025–2026 projections). Rates reflect average residential customers with standard tiered pricing — see how utility rates, fees, and usage work together for what's inside those figures. \* Hawaii's electric estimate uses standardized 900 kWh/month; Hawaii's actual average household usage is ~515 kWh/month (EIA FAQ); at the 33.7¢ rate that is a realistic electric bill of about $174/month.
Reading the table against your own bill: each electric figure is your state's average residential rate multiplied by the same 900 kWh, so differences from your own statement usually trace to usage, your rate plan, or the season. To put your numbers alongside these, see how to read your utility bill, line by line — and plan for seasonal swings, not just averages.
What’s Driving These Differences? Key Factors Explained
Why do utility costs vary so much? It’s never just one factor. Here are the top five drivers behind the 2026 state-level differences:
- Energy mix: States with more hydro, nuclear, or wind (e.g., Idaho, Washington) have lower generation costs. Those relying on imported oil/gas (e.g., Hawaii, Northeast) pay more.
- Climate: Hot, humid states (FL, TX) use more electricity for cooling. Cold states (MN, ME) use more gas for heating.
- Infrastructure age Older grids and pipes mean higher maintenance and leakage costs—passed directly to consumers (e.g., Pennsylvania, Louisiana).
- Regulation type In regulated states (e.g., Ohio, Indiana), utilities earn guaranteed returns, leading to stable but sometimes higher rates. In deregulated states (e.g., Texas, Pennsylvania), market competition can lower prices—but also cause spikes during extreme weather.
- Policy goals States pushing renewables or decarbonization (e.g., California, Massachusetts) often have higher short-term rates to fund upgrades, even as long-term savings accrue.
For example, compare Idaho and Hawaii: both have similar populations (~1.8M), but Idaho’s large hydropower dams and flat terrain make infrastructure cheap to build and maintain. Hawaii’s islands require fuel shipments and complex desalination—costs reflected in every dollar on your bill.
Also, remember: utility bills include more than just energy. Water/sewer is often overlooked, yet it accounted for 12–20% of total utility spending in 2026 for most households—especially in drought-prone areas where conservation fees kick in.
How to Use This Data for Smart Decisions
If you're moving, budgeting, or evaluating a job offer, knowing where utility costs stand helps you avoid nasty surprises. If a move itself is the trigger, start with our guide to moving utilities to a new address. Here's how to apply this data:
- Compare total housing cost: A lower rent in a high-utility state (e.g., Massachusetts) can be offset by a higher rent in a low-utility state (e.g., Texas). Use the state-by-state averages above to model your real monthly costs.
- Factor in seasonality: In Minnesota, summer electric bills may be 40% lower than winter gas bills. Plan for seasonal swings—not just averages.
- Check your local utility’s plan Even within a state, rates vary by provider. In Texas, for example, rate variations between providers can exceed 20%. Not sure which plan fits? See which electricity rate plan fits your household.
- Ask about rebates Many states (e.g., Colorado, Oregon) offer income-qualified energy assistance or efficiency upgrades that reduce bills long-term.
And if you’re already a homeowner: small upgrades (LED lighting, programmable thermostats, water-efficient fixtures) often pay for themselves in under two years—even in high-cost states.
Related Reading
- What the charges on an electricity bill actually are — every line item above the table figures, explained.
- How to read your utility bill, line by line — decode your own statement against these averages.
- Which electricity rate plan fits your household — what to do when rates vary by provider.
- How to lower your water bill — action steps for the fastest-rising line on the bill.
- Moving utilities to a new address — the planner’s checklist for the switch itself.
How much more expensive are utilities in high-cost states like Hawaii versus low-cost states like Idaho?
Which states saw the biggest increases in utility costs from 2025 to 2026?
Are utility bills higher in urban or rural areas?
Do utility costs include taxes and fees?
How accurate are these 2026 projections?
Can I reduce my utility bill even in high-cost states?
Where can I find my state’s exact utility rates?
Sources
- U.S. Energy Information Administration: How much electricity does an American home use?
- U.S. Energy Information Administration: Electricity Monthly Update
- U.S. Energy Information Administration: Electric Sales, Revenue, and Average Price
- U.S. Energy Information Administration: Residential Energy Consumption Survey